
Checking Economic Evaluation Result
After the calculation is completed, except for parameters displayed in the operation pane, you are enabled to check the economic evaluation indices and sensitivity of economic indices, and export financial statement.
Economic Evaluation Index
On the Economic Evaluation index page, check the basic indices of wind farm, user earning analysis, shareholder earning analysis, etc. and export analytic statement.
-
Click the Economic Evaluation Index tab.
The following modules are consisted on this page:
Module Description Wind farm basic index Include wind farm overview, project overall investment, project overall earnings, and detailed economic evaluation indices, such as main economic evaluation index, construction period investment/operation period index, and electricity sales index. Bidding sensitivity analysis Evaluate total investment IRR after tax and capital IRR after tax by increasing and decreasing 5% and 10% of the value of specific variant. User earning analysis Demonstrate the earning parameters of each period and self-served power production parameters of each month. The self-served power production parameters are displayed in a line chart. Shareholder earning analysis Show the financial IRR and NPV of each shareholder. - Click the Export analytic statement button to export all indices on this page to an Excel file. Multiple worksheets are included in the Excel file for various types of indices.
Bidding Sensitivity Analysis
On the Bidding sensitivity analysis page, select the variate and index and define the variation pattern of the variate to view the change of selected index along with the rise and fall of variate. This function helps you predict the better and worse situations.
- Click the Bidding sensitivity analysis tab.
- Select an analysis type.
Electricity Price Negotiation Analysis
This analysis type calculates the sensitivity of parameters related to electricity price by defining threshold value and variation interval of economic evaluation index, which provides reference for electricity price negotiation.
- Select Electricity price negotiation analysis as analysis type.
- Select a variate. The options are consisted of price discount, intermediary fee, annual land rent, and ratio of self-served power. When you select price discount, you will need to select electricity usage as electricity price for sales to grid and/or electricity price for sales to corporate users.
- Select a target economic evaluation index. The options are consisted of capital IRR (AT) (%), total investment IRR (%), LCOE (RMB/kWh), capital financial NPV (AT) (10k RMB), and total investment financial NPV (AT) (10k RMB).
- Set up threshold value and variation interval. Threshold value is the minimum value of the target index. Variation interval is the variation range of each level the index value rises or falls.
- Click OK. The sensitivity analysis table is displayed below the setting zone. In the table, the values of selected economic evaluation index varies higher and lower by three levels, and the corresponding values of selected variate are listed.
Univariate Sensitivity Analysis
This analysis type calculates the economic evaluation index by selecting variate and its variation pattern, which weights the sensitivity of the selected economic evaluation index.
Bivariate Sensitivity Analysis
This analysis type calculates the economic evaluation index by selecting two variates and their variation patterns respectively, which weights the sensitivity of the selected economic evaluation index.
-
Click OK.
The sensitivity analysis table is displayed below the setting
zone.
In the table, the values of two selected variates are displayed
while they vary higher and lower by a defined number of levels, and the
corresponding values of selected output variate are listed.
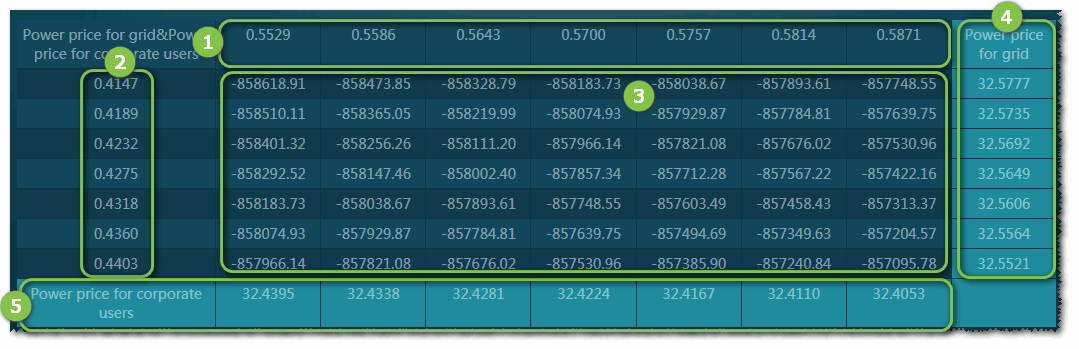
- ①: Variate 1
- ②: Variate 2
- ③: Output variate
- ④: The value of variate 1 to achieve the threshold value of the output variate
- ⑤: The value of variate 2 to achieve the threshold value of the output variate