
Configuring Grid-Connected Substations
Before access plan design, you must configure the access points in a access station. At the same time, you may define electricity price for it.
Before configuration, ensure there is at least a grid-connected substation object in the project. For details about how to create a grid-connected substation, refer to the section Creating a Substation Object.
Double-click the grid-connected substation object in the project pane. The access configuration page opens.
Configuring Access Point
- Click the Access point tab.
- Click Add an access point. An new row is added with no value in the access point parameter columns. Among the parameter columns, the Access Type column is filled with the grid-connected substation access type predefined in the creation process, and it is not editable.
- Click the cells to set up the parameters, including access point name, voltage grade, and maximum monospace accessible capacity. The value of maximum monospace accessible capacity is displayed automatically based on the voltage grade you select, and is editable.
-
Repeat Step 2-3 to add more access points.
Note: When the access type is T-access circuit, no more than one access point is permitted.
-
(Optional) Click the copy icon
 to copy the corresponding access point.
-
(Optional) Click the delete icon
 to delete the corresponding access point.
Note: If the substation has been designed for access plan, the point might have been connected to a turbine. In this case, if you delete this point, the completed access plan would be unavailable. It is recommended not to edit or delete access point after access plan design.
to delete the corresponding access point.
Note: If the substation has been designed for access plan, the point might have been connected to a turbine. In this case, if you delete this point, the completed access plan would be unavailable. It is recommended not to edit or delete access point after access plan design. -
Click Save to save all the modification.
The system judges the access applicability based on the
grid-connected substation parameters. The judgment result is displayed at
the left bottom of the page. The result should be one of the following:
with access conditions, without access
conditions, or consider
T-access.Note: While creating a grid-connect substation, the accessible capacity is calculated based on substation capacity and accessed new energy capacity. When the accessible capacity is lower than 2MW, this substation is not applicable in the access plan. To configure parameters for this kind of substations, the reminder Accessible capacity is less than 2MW is displayed at the left bottom of the page. When you click Save, the judgment result is The access capacity is less than 2MW, and there is no access condition. To cope with this situation, open the operation pane of the grid-connect substation to modify the value of accessible capacity. Refer to the section Modifying Substation Properties for more details.
Configuring Electricity Price of Access Station
- Click the Access Station Price tab.
- Select the user type. The available options are: electricity grid, electricity sale company, and electricity consumption enterprise. The selected user type(s) are displayed in your selection order.
- Input the company name in the text box at the right side of each user type.
-
Define the electricity price period of each user type.
- Click the Define Period button to open the Month Definition window.
- Click Add month. Period1 is added.
- Click the + icon in the Period1 area to select months for this period. You can select more than one months.
-
Repeat Step b-c to add more periods and select months for each of
them.
Note: In the list of months for selection, the selected ones are disabled.Note: The total number of selected months should be 12 without anyone missing.
- (Optional) Click the × icon at the right side of a month name to delete it.
-
(Optional) Click the delete icon at the right side of the period to delete the corresponding period.
- Click the OK button to save the settings. Each period is displayed as a distribution bar with 24 hours.
-
Define the electricity price of each time segment.
- Click on the distribution bar of a period. The bar (24 hours) is divided into two time segments by the time point you click.
- Click again to divide one of the two time segments into another two segments by the time point you click. At this moment, the bar is divided into three segments.
- Repeat the steps above to divide the 24 hours of a day into several time segments. Each time point is marked with its time.
- (Optional) Drag the time point marker to adjust its time.
- (Optional) Click the time point and click Delete to delete this point. The two segments before and after the deleted time point are combined into one, and the price of the longer segment is adopted.
- Input the electricity price of each time segment.
-
Define load data.
Note: This step is only applicable for electricity consumption enterprise. If you selected electricity grid or electricity sale company, skip this step and directly go to Step 7.
Two methods are available to input load data:
- Sequential values: Define the load curve by importing load file with time series data. The data are usually in great amount from monitor.
- Select Sequential values.
- Click Download template to download the template file. Sequential value load sheet is an Excel file with time and electricity load, and the format is xlsx or xls.
- Input the electricity load value of each time point.
- Save changes in the file.
- Click the Browse button to upload sequential load file. After the upload is completed, the Browse button is replaced by the Replace button. Click this button to reload the load data file.
- Statistics: Define he load curve by inputting load statistics. The data are usually in small amount from electricity meter.
- Select Statistics.
-
Click the Edit button to open the Edit Load Data window.
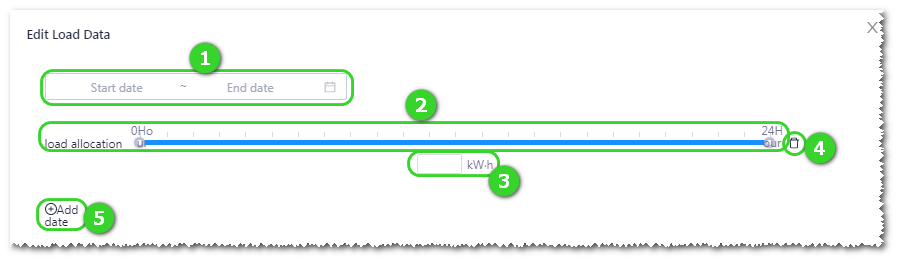
- Click Add date (⑤) to add a period and define its load.
- Click in the time selection area ① to define the start and end date of the period.
- Click on the distribution bar ②. The bar (24 hours) is divided into two time segments by the time point you click.
- Click again to divide one of the two time segments into another two segments by the time point you click. At this moment, the bar is divided into three segments.
- Repeat Step e and f to divide the 24 hours of a day into several time segments. Each time point is marked with its time.
- (Optional) Drag the time point marker to adjust its time.
- (Optional) Click the time point and click Delete to delete this point. The two segments before and after the deleted time point are combined into one, and the load value of the longer segment is adopted.
- Input the load value in each time segment in the text box ③.
- Repeat Step c-j to define load data for more periods.
- (Optional) Click the delete icon ④ at the right side of a period to delete this period.
- Click OK to save the settings and close the window.
Note: If you configured both sequential values and statistics, the sequential values are applied in the access plan calculation.After the load data are input or imported successfully, the load curve is displayed in the load data area.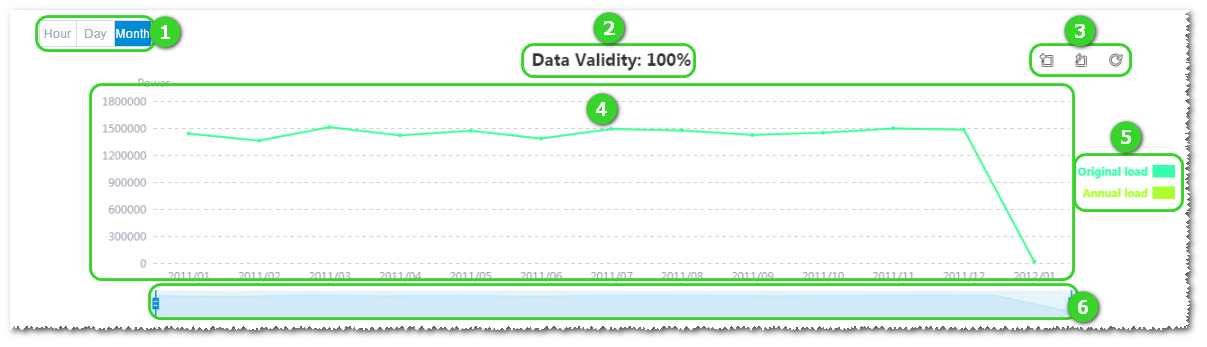
Table 1. Areas in Load Curve Graph No. Name Description ① Data granularity options Select the data granularity as hour, day, or month. If the granularity of data you imported is day, the display of monthly data graph is available, but not the hourly one. ② Data Validity Display the ratio of annual data validity based on coverage of source data. If the source data are not complete, the system will automatically repair them. ③ Curve scaling and restoring Zoom in a section of the graph, cancel the zoom in, and restore. ④ Load curve Display data graph in a year. Hover the pointer over the curve to check the time and load value of the corresponding point. ⑤ Curve options Click the legend to show or hide original load or annual load in the graph. Original load is the load data sourcing from the user, and annual load is annual load data supplemented by the system based on original ones. ⑥ Time shaft Drag the slider to select time range to be displayed. - Click Save to save all the modification.