
Mast Library
Mast library collects data of all the masts under the Domain hierarchy. By selecting some filtration criteria, you can evaluate and analyze the characteristics of masts, and determine the key factors of masts for future siting project.
Choose Mast Library > Mast Library to open the Mast Library page.
| No. | Name | Description |
|---|---|---|
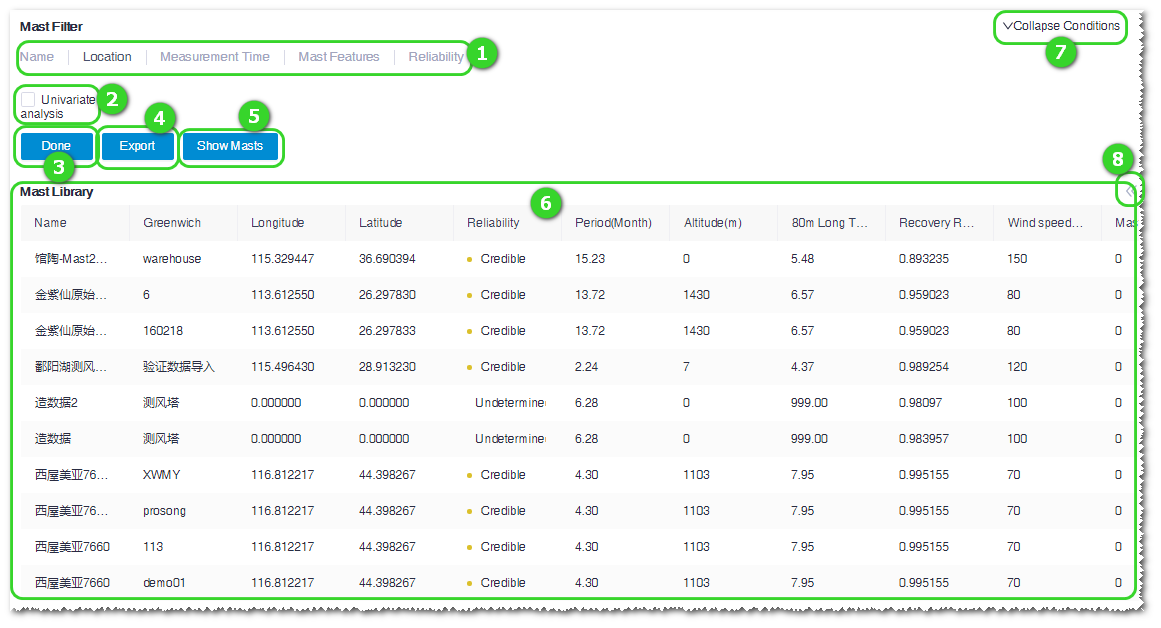
| ① | Mast filter | Mast filter criteria consist of name, location, measuring time, mast features, and reliability. Select the desired filter items, input the details, and click OK ③ to display masts after filtration in the mast library table ⑥. For details, refer to Mast Filter Criteria. |
| ② | Univariate analysis | Select the Univariate analysis item to perform the univariate analysis after you input the variate and model for analysis. For details, refer to Univariate Analysis. |
| ③ | Done button | Click Done to apply the filters. |
| ④ | Export button | Click Export to export the mast data table as an Excel file. |
| ⑤ | Show masts button | Click the Show Masts button to show the location of masts in GIS. |
| ⑥ | Mast library table | Display mast data. |
| ⑦ | Collapse/expand icon | Click this icon to collapse ① and ②. Click it again to expand all the filter items. |
| ⑧ | Expand icon for property items | Click this icon to open the Property list. Select options in this list to add columns into the data table ④. |
Mast Filter Criteria
Mast filter criteria consist of name, location, measuring time, mast features, and reliability. The method to filter masts are shown as follows:
- Click the criteria name. The filter items under this criteria are displayed.
- Select the filter items to display them under the criteria.
Table 2. Introduction to the Mast Filter Items Criteria Item Description Name Name Filter masts according to name. Location Administrative Filter masts by defining province/city/town (domestic only). Coordinate range Filter masts by longitude and latitude. Measure time Period Input the number of months of measurement period Service start Select start date of measurement. Service end Select end date of measurement. Mast Features Recovery rate Specify the percentage of data effectiveness Avg Speed Specify average wind speed. Unit: m/s Power density Specify wind power density. Unit; w/m2 Rep TI Specify representative turbulence level according to the IEC standard. Avg TI Specify average turbulence level according to the IEC standard. Wind speed K Specify the Weibull K value. 80m Long term Specify the corrected long-term wind speed at the height of 80m. Unit: m/s Mesoscale 120m wind speed(m/s) Specify the corrected long-term wind speed at the height of 120m. Unit: m/s Mesoscale 140m wind speed(m/s) Specify the corrected long-term wind speed at the height of 140m. Unit: m/s Extrapolate Specify the corrected extrapolate. Temperature Specify the average temperature. Unit: °C Pressure Specify average pressure. Unit: kPa Humidity Specify average humidity. Air density Specify average air density. Unit: kg/m3 Annual ice hrs Specify average number of annual freeze hours. Unit: hour 50yr max speed Specify the maximum wind speed within 50 years. Unit: m/s Reliability Credible The data are credible. Undetermined The data reliability is undetermined. False The data are false. Note: You can select multiple filter items for one filtration. To deselect a filter item, clear the check mark in the check box before this item. - Input the filter content, and click Done. The filtration is done.
Univariate Analysis
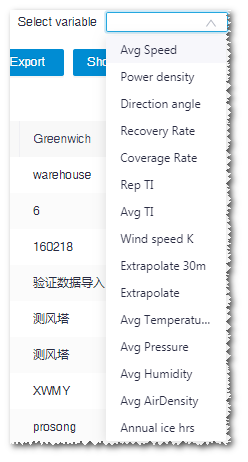
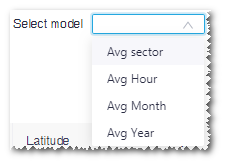
Select the Univariate analysis option, and select the variable and model to analyze mast data after filtration. The table below displays the selected variable in the specified model.
| Mode | Description |
|---|---|
| Avg sector | Analyze the tower data in 12 sectors |
| Avg hour | Analyze the mast data within 24 hours |
| Avg month | Analyze the mast data within 12 months |
| Avg year | Analyze the mast data by year |