If the selected mast is in the timsigma format, the available types are Turbulence or WindSpeed and Turbulence. After calculation, you can verify turbine turbulence and shear on the Load Analysis page.
To analyze turbine load, ensure the following tasks have been completed:
- In the configuration of AEP calculation in the real frequency mode, select a mast in the timsigma format and define the mast type as Turbulence or WindSpeed and Turbulence.
- The AEP calculation is completed.
For details of AEP calculation in the real frequency mode, refer to the section Calculating AEP - Real Frequency.
-
Double-click the WTG group object in the project pane. The WTG group overview page opens.
-
Click the Load Analysis tab.
-
Select a analysis mode.
| Mean TI |
The turbulence intensity at the turbine location equals to the mean turbulence value of every wind speed levels. (P50) |
| Representative TI |
The turbulence intensity at the turbine location covers almost
90% of the ambient turbulence scope by considering dispersion of
ambient turbulence. (P90) |
| Extrapolate |
The wind speed at each height of each direction, provided by model simulation, is analyzed by comparing with actual extrapolate. |
-
Select turbine locations in the Layout list.
Select All to select all the turbine locations.
-
Select Turbulence Class. The selected turbine locations are to be filtered based on the filtration of their turbulence.
| Turbulence Class | Description |
|---|
| A+ |
This is a turbulence class from the IEC standard covering turbulence intensity larger than 0.16 at the wind speed of 15m/s.
|
| A |
This is a turbulence class from the IEC standard covering turbulence intensity between 0.14 and 0.16 at the wind speed of 15m/s.
|
| B |
This is a turbulence class from the IEC standard covering turbulence intensity between 0.12 and 0.14 at the wind speed of 15m/s.
|
| C |
This is a turbulence class from the IEC standard covering turbulence intensity smaller than 0.12 at the wind speed of 15m/s.
|
-
Select a number in the Sector drop-down menu.
-
Click the Create button to generate turbulence curve at the turbine locations.
-
Click the Export Report button to export the turbulence report.
-
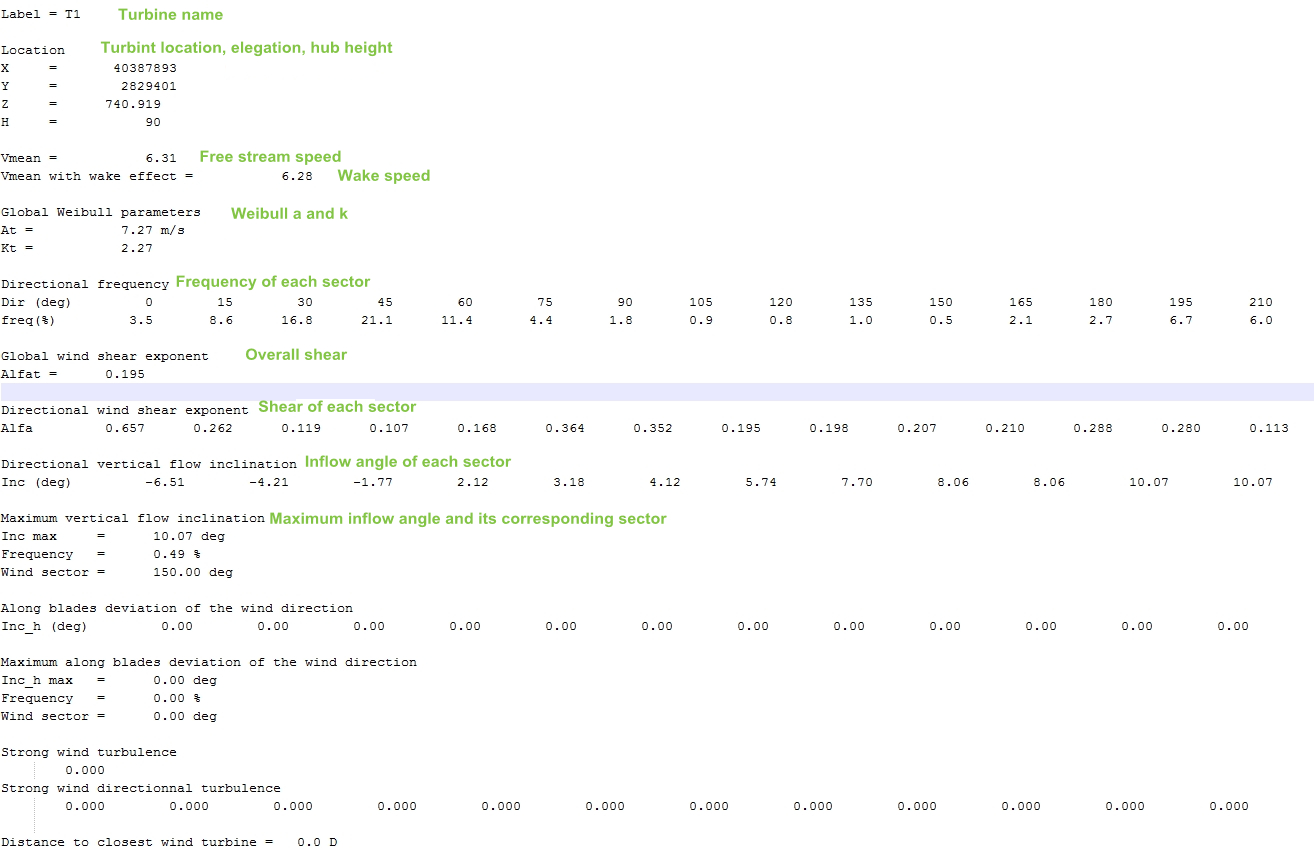
Click the Export Turbulence Metrics button to export a metrics file in the txt format. Its format is shown in the following figure:
-
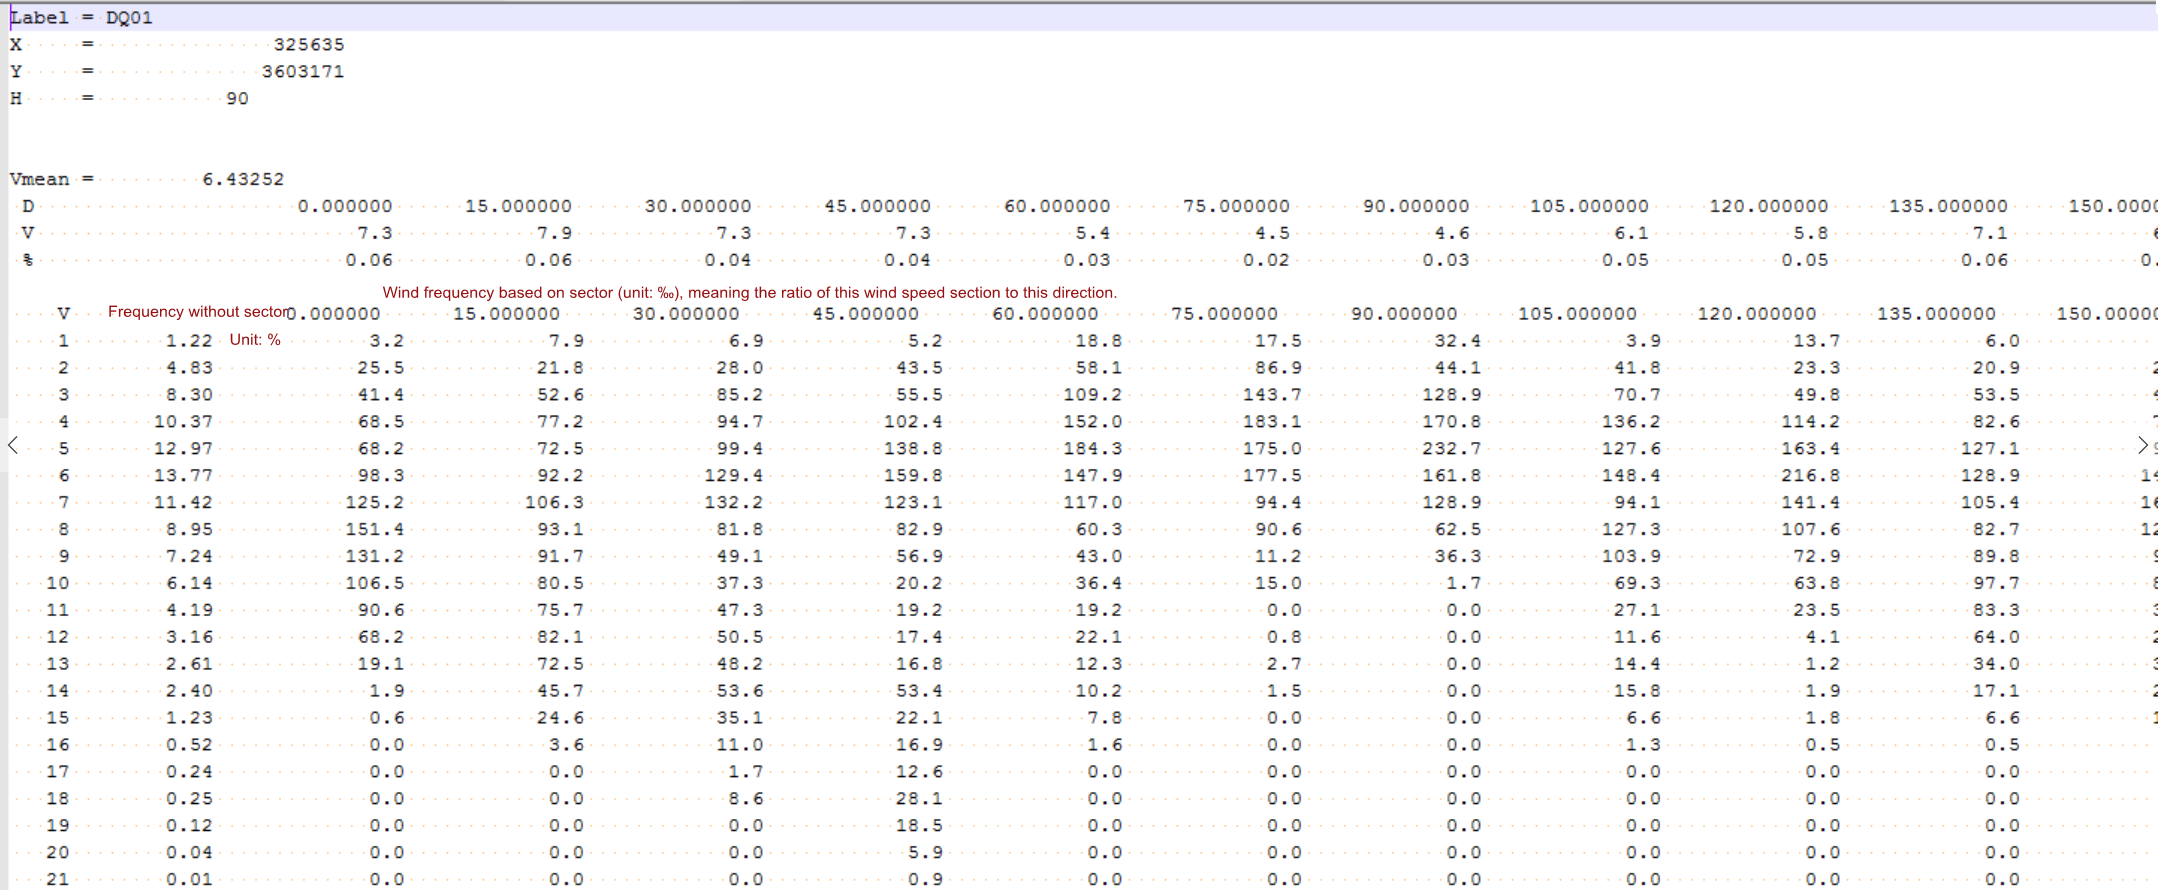
Click the Export Wind Distribution Metrics button to export a metrics file in the txt format. Its format is shown in the following figure: