
Calculating AEP - Real Frequency
In this mode, the calculation is performed based on CFD wind speed factor, mast time series/real frequency, and power curve. If the selected mast is in the timsigma format, you can verify turbine turbulence after calculation.
-
Select Real Frequency in the AEP Calculation
Type area.
Figure: AEP Calculation Interface - Real Frequency 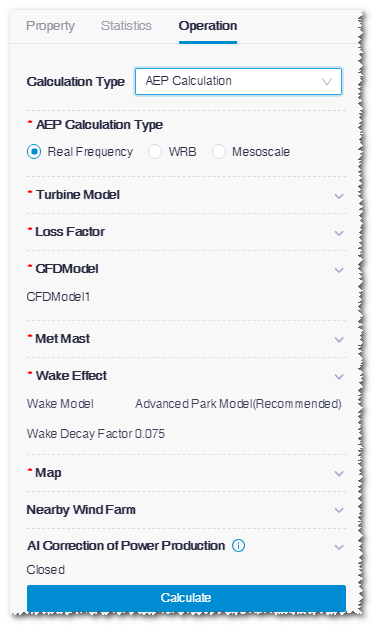
-
Click the expand icon
 in the
Loss Factor area.
in the
Loss Factor area.
-
Click the expand icon in the CFDModel area.
-
Click the expand icon in the Met Mast area. All
the mast objects in the projects are listed.
-
Click the expand icon in the Wake Effect area to
set up wake effect model and wake decay constant.
The Park model applied in Greenwich is a simple Park model calculating maximum upwind wake flow; Complex Park model is the same as WAsP model with consideration of wake flow overlay effect of multiple rows of turbines. Wake decay constant is a parameter in Park model, representing the wake effect expansion ratio along axis. Normally, input 0.075 for wind farms onshore, and 0.04 for wind farms along the shore of East China Sea.
-
Click the expand icon in the Map area. All the map
objects in the projects are listed.
-
Click the expand icon in the Nearby Wind Farm
area, select nearby wind farm(s), and configure the selected wind farm(s) to
calculate the wake influence between the current wind farm and nearby wind
farm(s).
Note: The settings in this area are not mandatory. If no wind farm is nearby, skip Step 21-22.
- Select the wind farm object in the list. The options in the list are wind farm objects in the project other than the current wind farm.
- Click the Config button at the right side of selected wind farm to open the corresponding overview page.
- Set up the turbine model, hub height, and power curve of each turbine in the table.
- Click Save.
-
Click the expand icon in the AI Correction of Power
Production and turn on the switch to open this function.
Note: Currently, only turbines calculated by CFDRans within China and whose distance to mast is less than 10 km are supported.