Data Layers
Data layers can be displayed over the map for wind speed, weather, environment, and road network data, providing reference for wind farm siting judgement.
Click the data layers icon ![]() to expand the data layer pane.
to expand the data layer pane.
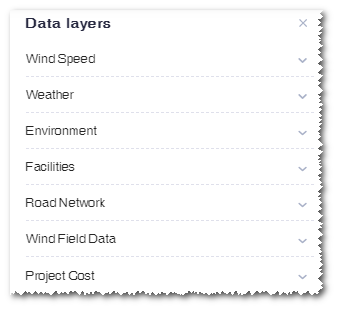
Wind Speed
The wind speed data layers consist of global wind speed map, 80m height hight resolution wind speed, 140m height hight resolution wind speed, China 80m height high resolution speed error, China 140m height high resolution speed error, China 80m-140m shear map, and Japan 30m wind speed.
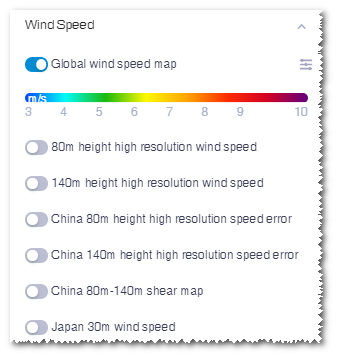
- Turn on the button to display its corresponding wind speed map.
- When a wind speed layer is turning on, click the transparency icon
 to open the slider, and drag the slider to adjust
transparency of the layer.
 - Hover the pointer over the legend. The corresponding wind speed number is shown.
Weather
The weather data layers shows the following data.
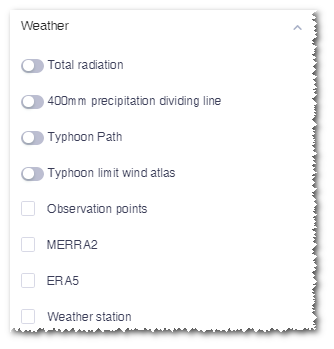
| Total radiation | Display the radiation distribution |
| 400 mm precipitation dividing line | Show the dividing line of 400 mm precipitation within China |
| Typhoon path | Show the typhoon path in coastal areas of China since 1985 |
| Typhoon limit wind atlas | Show the typhoon extreme wind map. The extreme wind speed in the typhoon-influenced areas are calculated according to the JTWC historical typhoon data. |
| Observation points | Show the mast locations in China collected by Greenwich database |
| MERRA2 | Mesoscale data points published by US |
| ERA5 | Mesoscale data points |
| Weather station | Show the location and information of over 2000 weather stations in China. |
To view the radiation layer, perform the following steps:
- Turn on the button or click the check box to display the corresponding weather map.
- When the radiation map layer is turning on, click the transparency icon
 to open the slider, and drag the slider to adjust
transparency of the layer.
 - Hover the pointer over the legend. The corresponding radiation number is shown.
- Click to check the Observation points layer. The observation points of all areas are displayed as bubbles. The size of each bubble is determined by the quantity of observation points.
- Click the bubble or zoom in the map to show individual observation points. (All individual observation points are displayed when GIS is zoomed in at Level 8.)
- Click a point. The pop-up window lists the mast time, mast height, mesoscale 90m wind speed, and mesoscale 140m wind speed.
- Click to check the Weather Station layer. The weather stations of all areas are displayed as bubbles. The size of each bubble is determined by the quantity of weather stations.
- Click the bubble or zoom in the map to show individual weather stations. (All individual weather stations are displayed when GIS is zoomed in at Level 8.)
- Click a weather station. The pop-up window lists the weather station name, average temperature, max temperature, min temperature, and average humidity.
- Turn on the Typhoon Path switch.
The path search options are displayed on the layer panel.
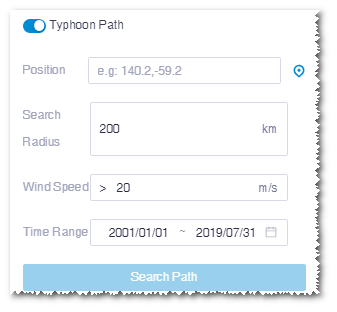
- Input the coordinate of searched point in the Location
field, or click the locate icon
 and click in GIS for the target point.
 - Input the radius of searched circle centered at the target point. The default value is 100 km.
- Input the minimum wind speed to be searched. The default value is 25 m/s.
- Click the Time Range field and select time range in the
pop-up calender.
The earliest typhoon data available is in 1985.
- Click the Search Path button.
In GIS, the typhoon paths which passed the assigned point within the selected time range are displayed and the color of the path shows the wind speed.
The coordinate, data source, time range, and typhoon records are shown in the layer panel.
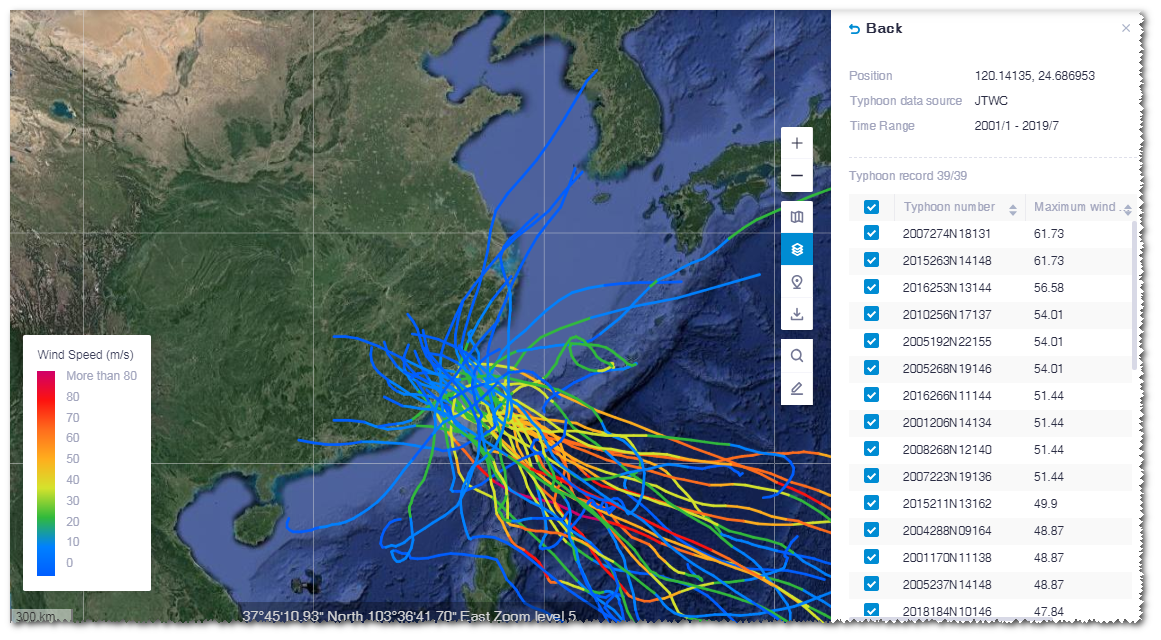
- Click a typhoon path in GIS. This path is highlighted and others are
greyed.
Each node on the path represents a typhoon record.
- Click a node.
The panel at the right bottom of GIS shows the information of this typhoon record, including position, release time, and maximum wind speed.
On the typhoon path, the wind speed data of this node is displayed, that is, the wind scope within 32.9m/s, 25.7m/s, and 17.5m/s.
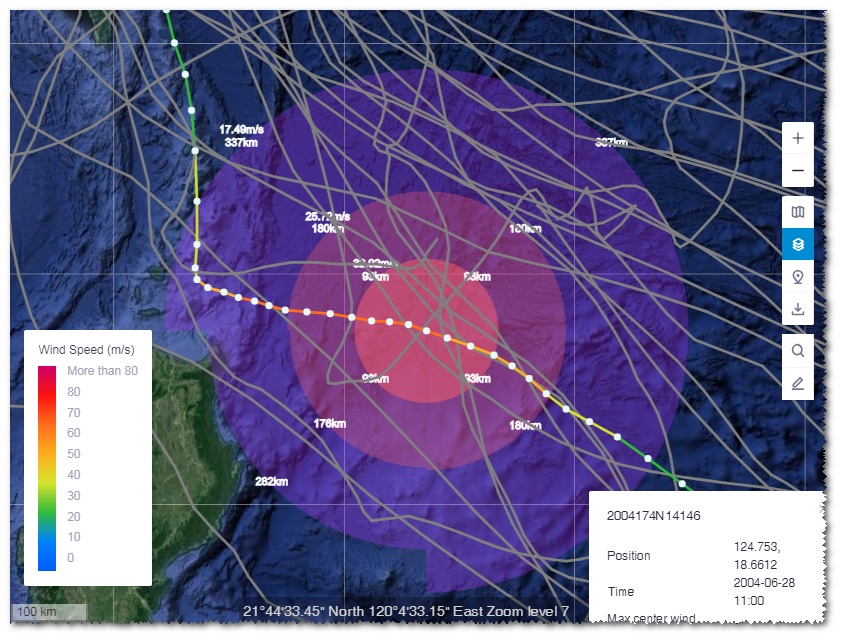
- Click Back on the layer panel to return to the path search option page.
- Turn on the Typhoon Limit Wind Atlas layer
switch.
The extreme wind map is displayed in GIS and the wind speed legend is shown on the layer panel.
Click the transparency icon
 to open the slider, and drag the slider to
adjust transparency of the layer.
 - Click in the wind map in GIS. The extreme wind speed information panel pops
up, showing the extreme wind speed within 50 years of this point
location.
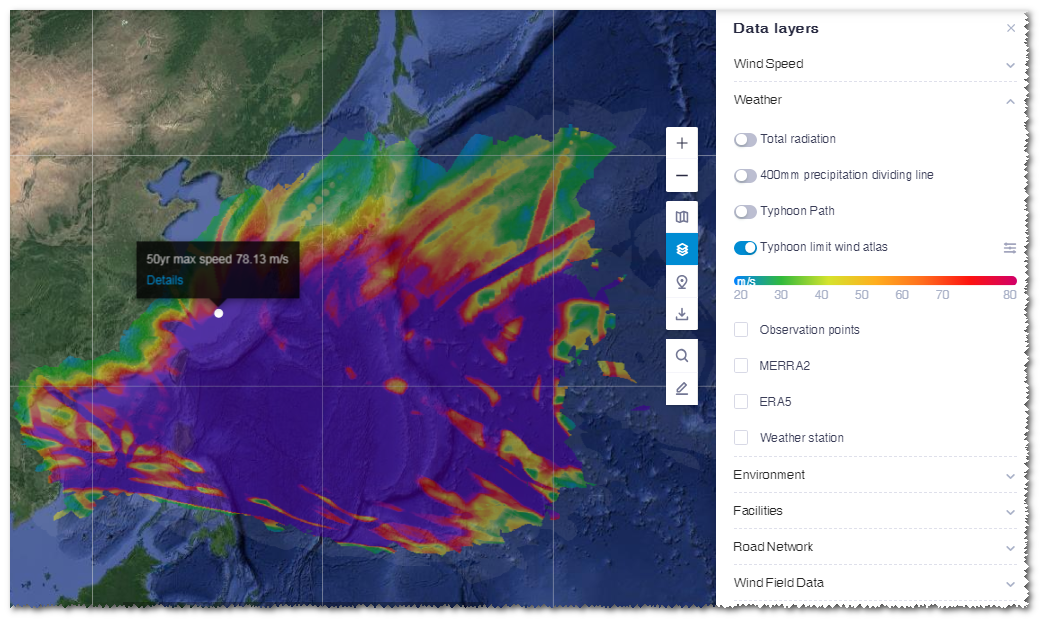
- Click Details in the information panel.
The historical typhoon paths influencing this point location are displayed in GIS. The wind speed is demonstrated by color.
On the layer panel, the corresponding point coordinate, wind speed height, extreme 10min wind speed within 50 years, extreme 3s wind speed within 50 years, typhoon data source, time range, and maximum wind speed in historical typhoon records are listed.
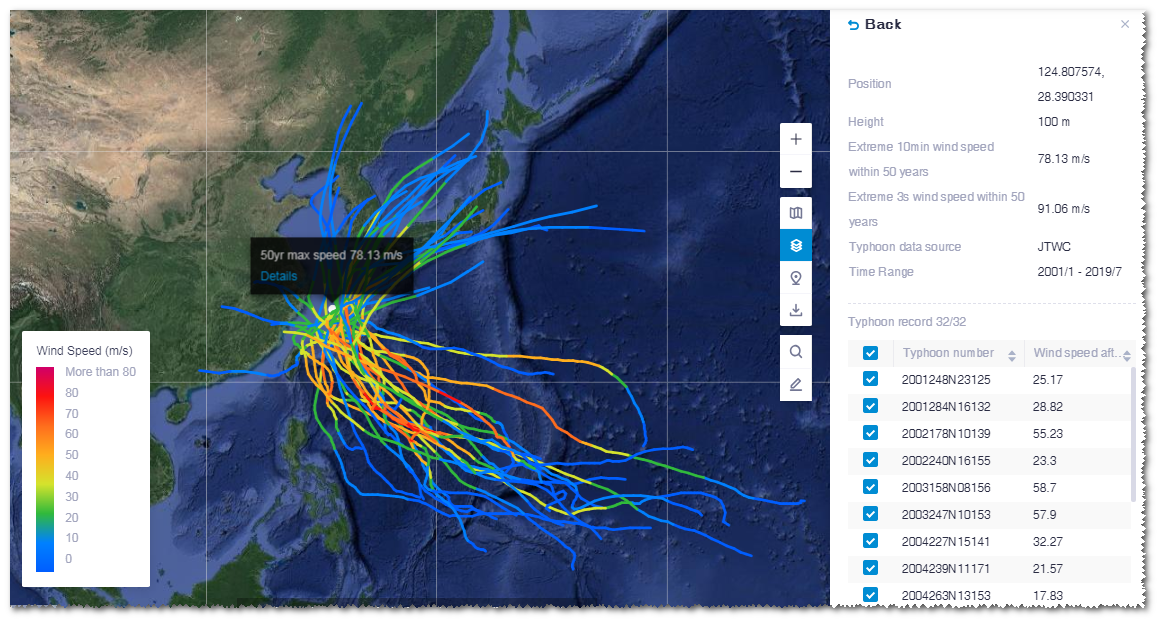
- Click a typhoon path in GIS. This path is highlighted and others are
greyed.
Each node on the path represents a typhoon record.
- Click a node.
The panel at the right bottom of GIS shows the information of this typhoon record, including position, release time, and maximum wind speed.
On the typhoon path, the wind speed data of this node is displayed, that is, the wind scope within 32.9m/s, 25.7m/s, and 17.5m/s.
- Click Back on the layer panel to return to the typhoon extreme wind atlas option page. You can re-select a point location to check its extreme wind speed.
Environment
Environment data layers are shown as in the figure below:
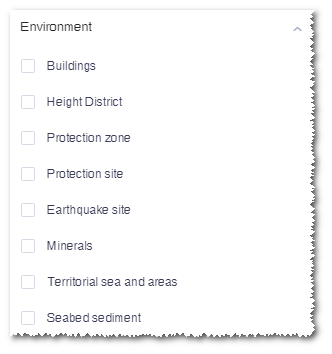
| Buildings | Buildings on the ground, including houses, factories, etc. The corresponding data are displayed only when the GIS is zoomed above Level 10. |
| Height district | The height district areas around the airport |
| Protection zone |
Protection zones published by WEO in 2009 |
| Protection site |
Protection sites published by WEO in 2009 |
| Earthquake site | Sites where earthquake ever happened as recorded by China Earthquake Administration (CEA) |
| Minerals | Mineral sites within the Chinese territory. The data is maintained by the Greenwich O&M team. |
| River | The river information outside China. |
| Land use info | The land use information outside China. The corresponding data are displayed only when the GIS is zoomed above Level 10. |
| Territorial sea and areas | The data sources are baseline of Chinese territorial sea published on official website of Chinese Foreign Ministry and Chinese Law on the Territorial Sea and Adjacent Zone. |
| Seabed sediment | The data source is Chinese Naval Hydrographic Office
(CNHO). The corresponding data are displayed only when the GIS is zoomed above Level 8. |
Facilities
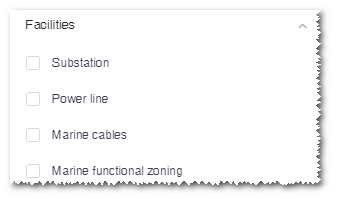
Click the check box before the options. The existing substations or power lines are displayed in GIS.
Road Network
Road network consists of bridge, expressway, national road, provincial road, prefectural road, low-level road, and large parts transportation risk map.
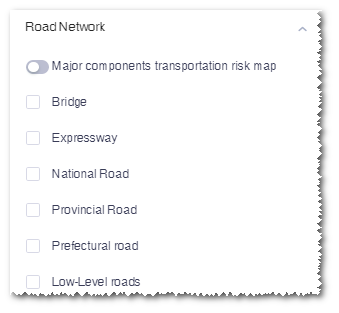
- Click the check box to display the roads and bridges in GIS.
- Turn on the button before the Large Parts Transportation Risk Map option.
- When the layer is turning on, click the transparency icon
 to open the slider, and drag the slider to
adjust transparency of the layer.
 - Hover the pointer over the legend. The corresponding transportation risk number is shown.
Wind Farm Data
Wind farm data consists of built wind farms and planned wind fields, including offshore wind farms.
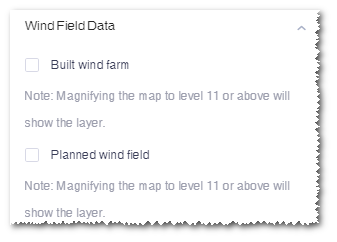
Click the check box before the option to show the built or planned wind farms in GIS.
- When the zooming level of GIS is lower than 11, the wind farms are displayed as points which are located at the center of wind farms. Click a wind farm point, its detail information is shown, including capacity, category, investors, and full load hours.
- When the zoom level of GIS is equal to or higher than 11, the wind farms are displayed as regions and the turbines within them (if any) are also displayed.
Project Cost
- Click to select the Project Cost layer. The project locations collected by data base are shown in GIS as yellow dots.
- Click a project. The pop-up window lists the name of project location,
budget estimation phase, hub height, capacity, unit investment, and BOP
cost. The selected project is displayed as a blue dot.
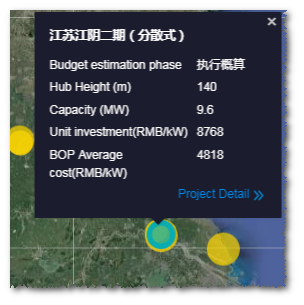
- Click Project Detail at the left bottom of this
window. The BOP budget estimation detail window pops
up.
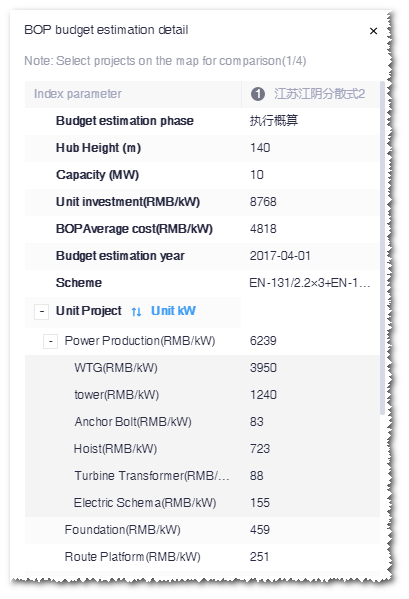
- This window shows the basic information, index parameter, BOP cost of the selected project.
- Click another project in GIS. Its information is added into the
BOP budget estimation detail window for
comparison with the first one.Note: You can add at most four projects. Click X at the right top of the project name to delete it from the table.
- In the Unit Project area, click the
 icon to
switch the index display by Unit kW or
Unit Number.
- Click the close icon at the right top of the window to close this window. All projects become deselected.
