
Address Detail
The address detail function provides an overview of wind resource parameters in the specified point, such as coordinate/elevation, Feed-in-Tariff (FIT), air density, roughness, wind speed, wind power density at 80/90/120m.
For wind farms in China, wind resource data sources are:
- MESOSCALE: Mesoscale data with the CNN wind accelaration factor from the latest simulation of Greenwich. These wind data are filtered by the wind quality standard and corrected by long-term correction.
- ERA5
- MERRA2
For regions outside China, only the MERRA2 and ERA5 data are provided.
Click the address detail icon ![]() to open the wind resource data pane.
to open the wind resource data pane.
Click a point in GIS. The monthly wind speed graph is displayed.
| No. | Name | Description |
|---|---|---|
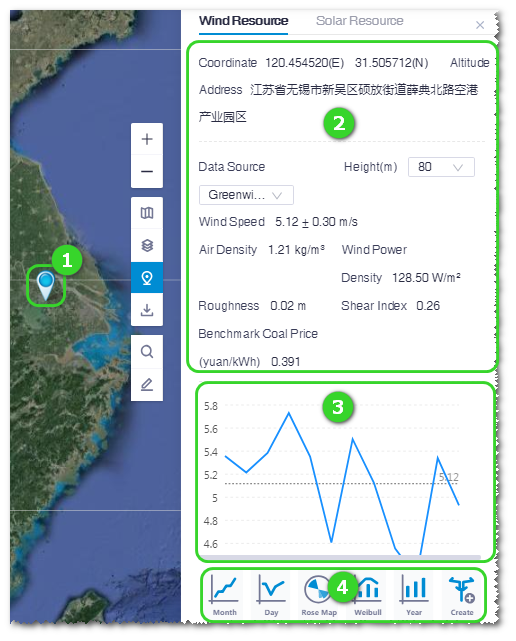
| ① | Point marker | Display point in GIS. |
| ② | Point parameters | Display coordinate, altitude, height, air density, roughness, wind speed, and wind power density of the clicked point. |
| ③ | Data graph | Display the data graph with selected graph type. Refer to ④ for graph type. |
| ④ | Graph type selection | Click the icons to display the respective data graph in ③. Refer to the section Wind Resource Data Icons for more details. |
Click the icons at the bottom of data pane to learn more about wind resource.
| Icon | Name | Description |
|---|---|---|
| Monthly profile | Display monthly distribution of wind speed, wind power density, and air density. | |
| Diurnal profile | Display diurnal distribution of wind speed and wind power density. | |
| Wind speed rose | Display the rose map of wind speed and wind power density. | |
| Weibull profile | Display the Weibull distribution. | |
| Wind speed long term profile | Display the annual distribution of wind speed. | |
| Create mast | Create a virtual mast in the project tree based on MERRA2 database. Refer to the section for more details Creating a Virtual Mast. |