Information Demonstration Area
Information demonstration area is to demonstrate information such as map, road network, terrain, roughness, turbine and mast location. In addition, the operation panel of each module is opened in this area, providing options and parameters of some specific objects.
The default view of information demonstration area is Geographical Information System (GIS). This section introduces each part of GIS. For details of the operation panels, refer to the sections for macrositing, planning and siting, EBA calculation, and other modules.
Figure: GIS Interface Overview
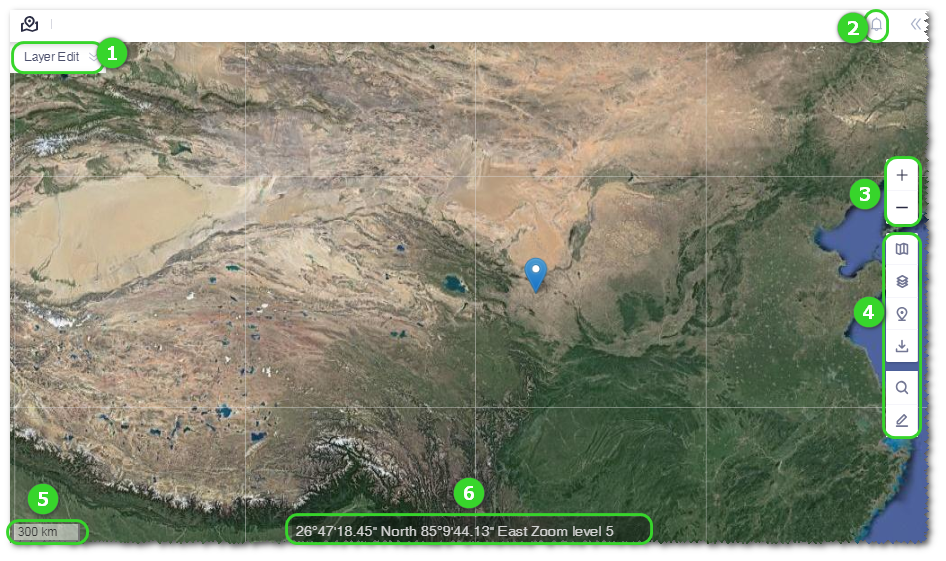
| No. | Name | Description |
|---|---|---|
| ① | Layer editor | This editor is displayed only when the specific object in Project tree is selected. The specific object should be map, CFD model, wind resource grid, WTG group, noise map, and wire, route and platform scheme. Expand the editor panel, select the corresponding tab, and select the content of object to be displayed in GIS. For more details, check the relative content in the CFD model, macrositing, noise, or platform design sections. |
| ② | Message pane | Click the icon  to open the message pane to check the task status and system notifications (including version upgrade and database update). If new task status or notification appears, a red dot will pop up at the right top of this icon. to open the message pane to check the task status and system notifications (including version upgrade and database update). If new task status or notification appears, a red dot will pop up at the right top of this icon. |
| ③ | Scaling | Click + or — to zoom in or out the map. Click the scaling button once, the map is zoomed in or out by one level. |
| ④ | Toolbar menu | Operation tools used for GIS are collected here, such as map layers |
| ⑤ | Proportional scale | Display the resolution ratio of the current map. |
| ⑥ | Cursor information | Display the longitude, latitude, and scaling level of the cursor point. |
Map Layers
Map layers are consisted of satellite map, simplified map, road network map, contour map, and roughness map. The main source is Tianditu. These maps enable you to compare the details of maps, in order to increase the accuracy of wind farm planning and designing.
Click the map layer icon
 in the toolbar menu. The map layer pane is expanded.
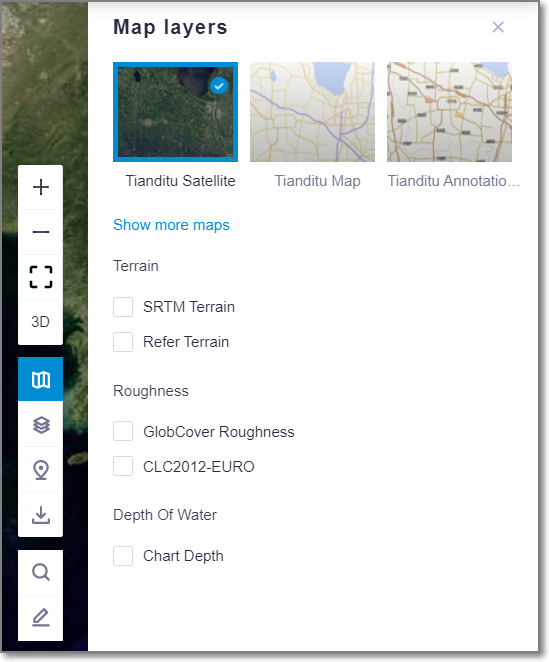
Click the map layers to display them in GIS.
The maps include Tianditu satellite map, Tianditu map (simplified map with main roads and without image; it is mainly used in road design), Tianditu annotations. Click show more maps to see Refer satellite map, Refer map, and Refer annotations.
The default view is Tianditu satellite map.
Select contour and roughness map and depth of water to view the terrain, roughness, and the water depth map.
The following maps are included: SRTM Terrain, Refer Terrain, GlobCover roughness map (global terrain map from GlobCover with resolution ratio as 300 m), CLC2012-EURO (roughness map of Europe), depth of water.
Note
Annotation maps and roughness maps and depth of water can be displayed over the other maps.
Data Layers
Data layers can be displayed over the map for wind speed, weather, environment, and road network data, providing reference for wind farm siting judgement.
Click the data layers icon ![]() to expand the data layer pane.
to expand the data layer pane.
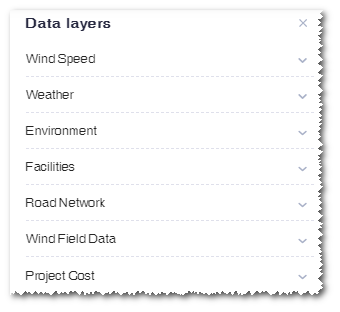
Wind Speed
The wind speed data layers consist of global wind speed map, 80m height hight resolution wind speed, 140m height hight resolution wind speed, China 80m height high resolution speed error, China 140m height high resolution speed error, China 80m-140m shear map, and Japan 30m wind speed.
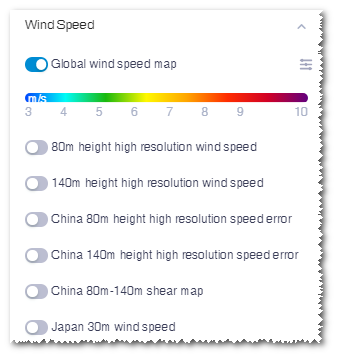
- Turn on the button to display its corresponding wind speed map.
- When a wind speed layer is turning on, click the transparency icon
 to open the slider, and drag the slider to adjust transparency of the layer.
 - Hover the pointer over the legend. The corresponding wind speed number is shown.
Weather
The weather data layers shows the following data.
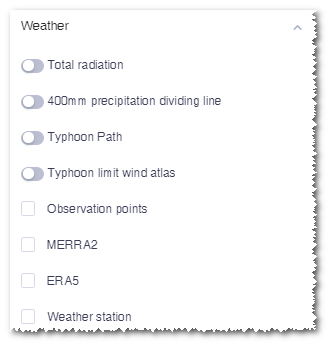
| Total radiation | Display the radiation distribution |
| 400 mm precipitation dividing line | Show the dividing line of 400 mm precipitation within China |
| Typhoon path | Show the typhoon path in coastal areas of China since 1985 |
| Typhoon limit wind atlas | Show the typhoon extreme wind map. The extreme wind speed in the typhoon-influenced areas are calculated according to the JTWC historical typhoon data. |
| MERRA2 | Mesoscale data points published by US |
| ERA5 | Mesoscale data points |
| Weather station | Show the location and information of over 2000 weather stations in China. |
To view the radiation layer, perform the following steps:
- Turn on the button or click the check box to display the corresponding weather map.
- When the radiation map layer is turning on, click the transparency icon
 to open the slider, and drag the slider to adjust transparency of the layer.
 - Hover the pointer over the legend. The corresponding radiation number is shown.
To view the weather station layer, perform the following steps:
- Click to check the Weather Station layer. The weather stations of all areas are displayed as bubbles. The size of each bubble is determined by the quantity of weather stations.
- Click the bubble or zoom in the map to show individual weather stations. (All individual weather stations are displayed when GIS is zoomed in at Level 8.)
- Click a weather station. The pop-up window lists the weather station name, average temperature, max temperature, min temperature, and average humidity.
To view the typhoon path layer, perform the following steps:
Turn on the Typhoon Path switch.
The path search options are displayed on the layer panel.
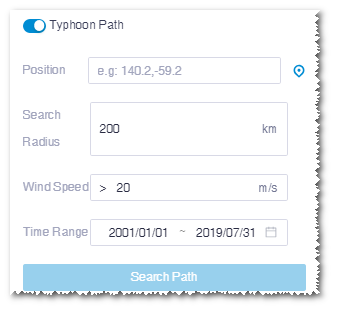
Input the coordinate of searched point in the Location field, or click the locate icon
 and click in GIS for the target point.
Input the radius of searched circle centered at the target point. The default value is 100 km.
Input the minimum wind speed to be searched. The default value is 25 m/s.
Click the Time Range field and select time range in the pop-up calender.
The earliest typhoon data available is in 1985.
Click the Search Path button.
In GIS, the typhoon paths which passed the assigned point within the selected time range are displayed and the color of the path shows the wind speed.
The coordinate, data source, time range, and typhoon records are shown in the layer panel.
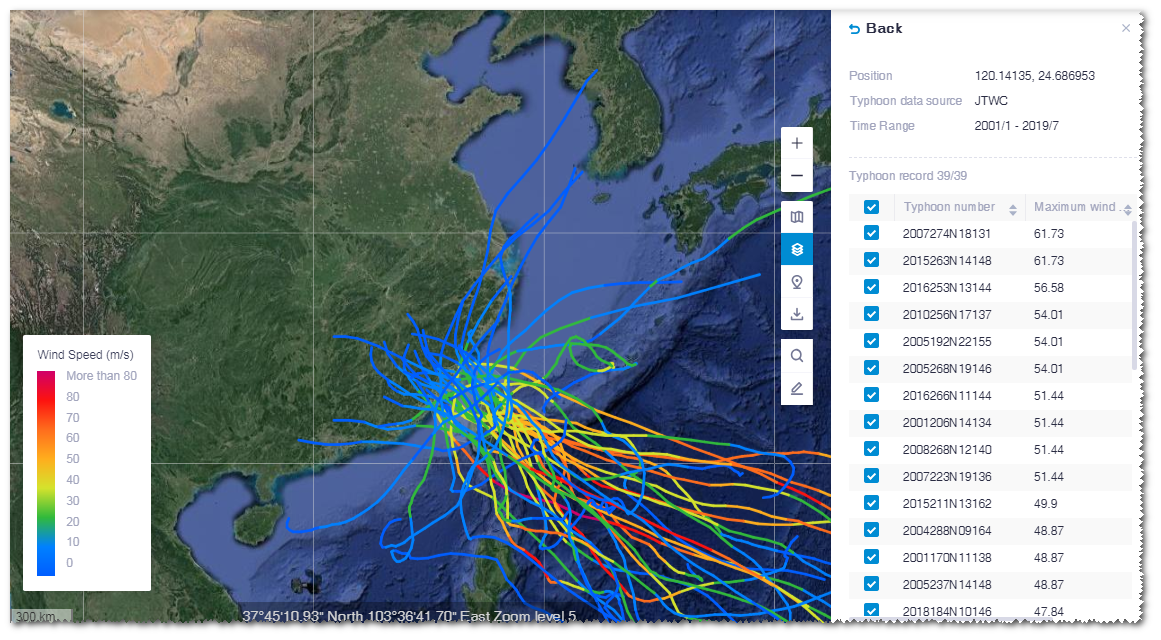
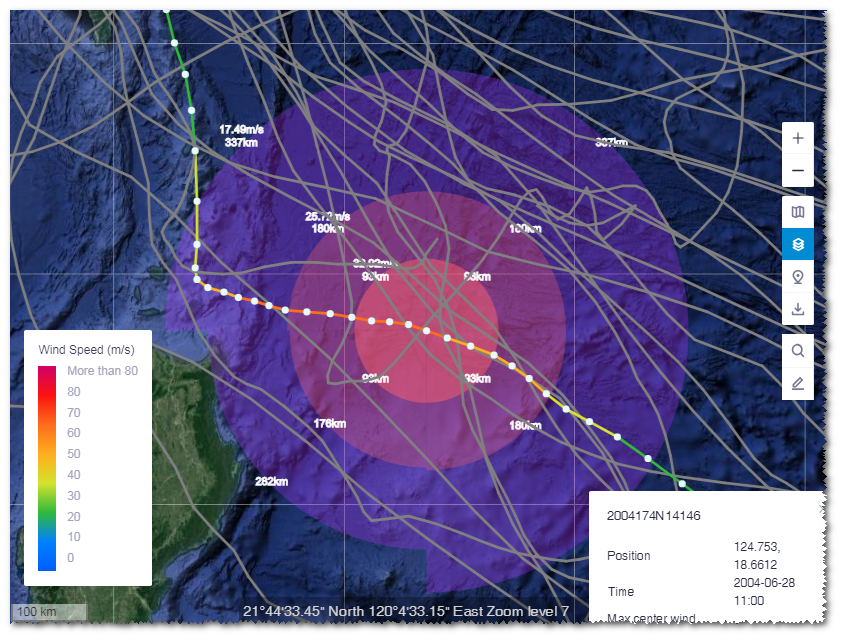
Click a typhoon path in GIS. This path is highlighted and others are greyed.
Each node on the path represents a typhoon record.
Click a node.
The panel at the right bottom of GIS shows the information of this typhoon record, including position, release time, and maximum wind speed.
On the typhoon path, the wind speed data of this node is displayed, that is, the wind scope within 32.9m/s, 25.7m/s, and 17.5m/s.
Click Back on the layer panel to return to the path search option page.
To view the typhoon extreme wind atlas layer, perform the following steps:
Turn on the Typhoon Limit Wind Atlas layer switch.
The extreme wind map is displayed in GIS and the wind speed legend is shown on the layer panel.
Click the transparency icon
 to open the slider, and drag the slider to adjust transparency of the layer.
Click in the wind map in GIS. The extreme wind speed information panel pops up, showing the extreme wind speed within 50 years of this point location.
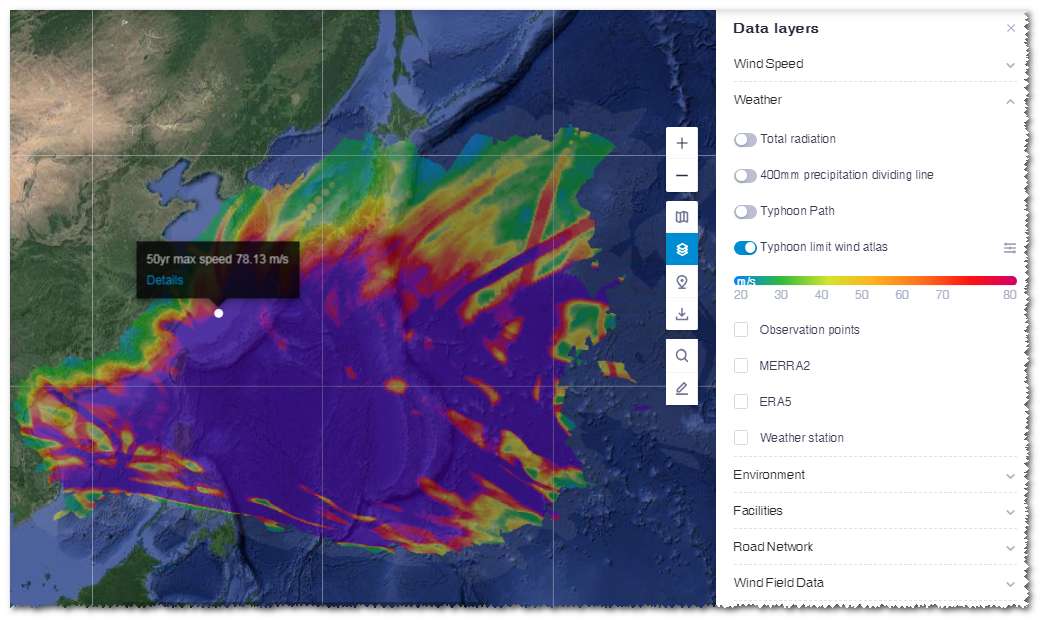
Click Details in the information panel.
The historical typhoon paths influencing this point location are displayed in GIS. The wind speed is demonstrated by color.
On the layer panel, the corresponding point coordinate, wind speed height, extreme 10min wind speed within 50 years, extreme 3s wind speed within 50 years, typhoon data source, time range, and maximum wind speed in historical typhoon records are listed.
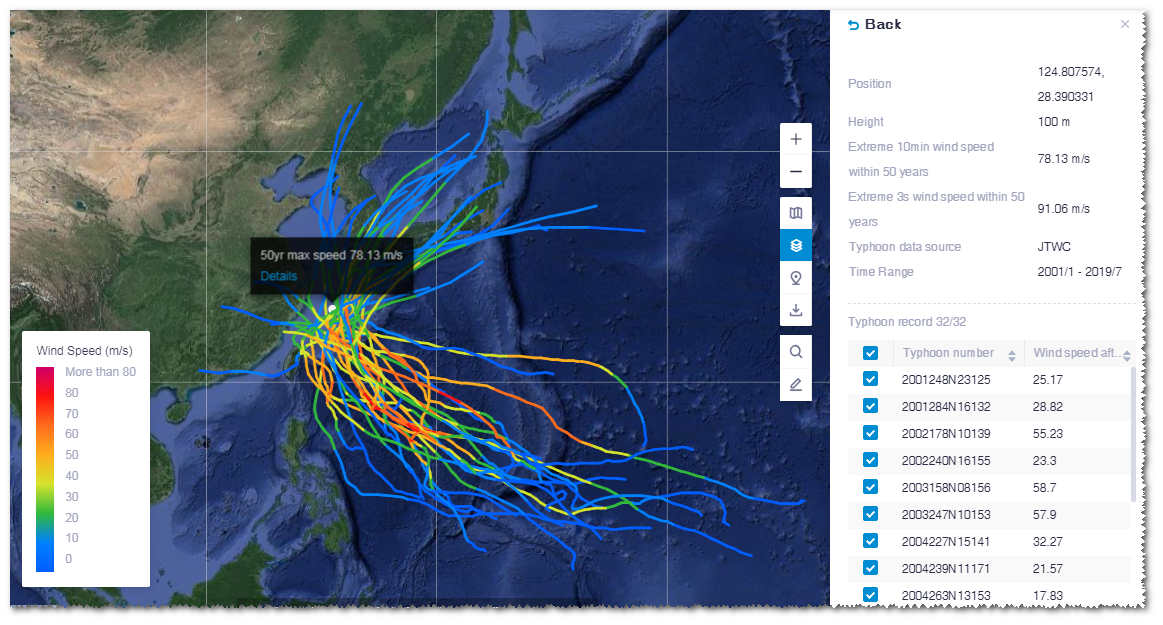
Click a typhoon path in GIS. This path is highlighted and others are greyed.
Each node on the path represents a typhoon record.
Click a node.
The panel at the right bottom of GIS shows the information of this typhoon record, including position, release time, and maximum wind speed.
On the typhoon path, the wind speed data of this node is displayed, that is, the wind scope within 32.9m/s, 25.7m/s, and 17.5m/s.
Click Back on the layer panel to return to the typhoon extreme wind atlas option page. You can re-select a point location to check its extreme wind speed.
Environment
Environment data layers are shown as in the figure below:
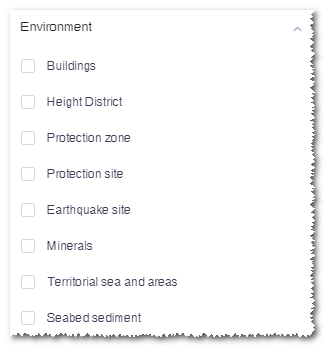
| Buildings | Buildings on the ground, including houses, factories, etc. The corresponding data are displayed only when the GIS is zoomed above Level 10. |
| Height district | The height district areas around the airport |
| Protection zone | Protection zones published by WEO in 2009 |
| Protection site | Protection sites published by WEO in 2009 |
| Earthquake site | Sites where earthquake ever happened as recorded by China Earthquake Administration (CEA) |
| Minerals | Mineral sites within the Chinese territory. The data is maintained by the Greenwich O&M team. |
| River | The river information outside China. |
| Land use info | The land use information outside China. The corresponding data are displayed only when the GIS is zoomed above Level 10. |
| Territorial sea and areas | The data sources are baseline of Chinese territorial sea published on official website of Chinese Foreign Ministry and Chinese Law on the Territorial Sea and Adjacent Zone. |
| Seabed sediment | The data source is Chinese Naval Hydrographic Office (CNHO). The corresponding data are displayed only when the GIS is zoomed above Level 8. |
Click the check box before the options. The data points are displayed in GIS.
Facilities
Facility database consists of substation and power line.
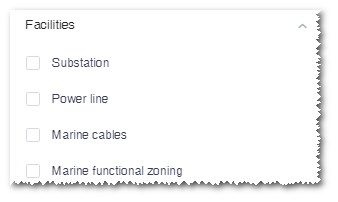
Click the check box before the options. The existing substations or power lines are displayed in GIS.
Road Network
Road network consists of bridge, expressway, national road, provincial road, prefectural road, low-level road, and large parts transportation risk map.
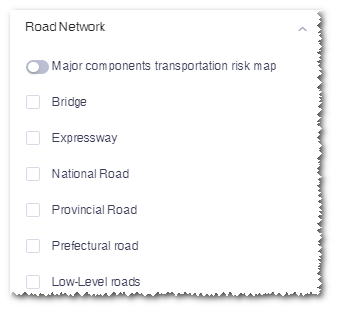
- Click the check box to display the roads and bridges in GIS.
- Turn on the button before the Large Parts Transportation Risk Map option.
- When the layer is turning on, click the transparency icon
 to open the slider, and drag the slider to adjust transparency of the layer.
 - Hover the pointer over the legend. The corresponding transportation risk number is shown.
Wind Farm Data
Wind farm data consists of built wind farms and planned wind fields, including offshore wind farms.
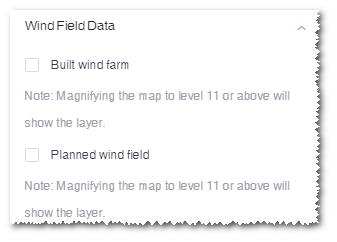
Click the check box before the option to show the built or planned wind farms in GIS.
- When the zooming level of GIS is lower than 11, the wind farms are displayed as points which are located at the center of wind farms. Click a wind farm point, its detail information is shown, including capacity, category,investors, and full load hours.
- When the zoom level of GIS is equal to or higher than 11, the wind farms are displayed as regions and the turbines within them (if any) are also displayed.
Resource Detail
The address detail function provides an overview of wind and solar resource parameters in the specified point, such as coordinate/elevation, Feed-in-Tariff (FIT), air density, roughness, wind speed, wind power density, total solar radiation, terrain aspect, terrain slope, optimal tilt angle.
Wind Resource Detail
For wind farms in China, wind resource data sources are:
- Greenwich Mesoscale data: Mesoscale data with the CNN wind acceleration factor from the latest simulation of Greenwich. These wind data are filtered by the wind quality standard and corrected by long-term correction.
- ERA5
- MERRA2
For regions outside China, only the MERRA2 and ERA5 data are provided.
Click the address detail icon ![]() to open the wind resource data pane.
to open the wind resource data pane.
Click a point in GIS. The monthly wind speed graph is displayed.
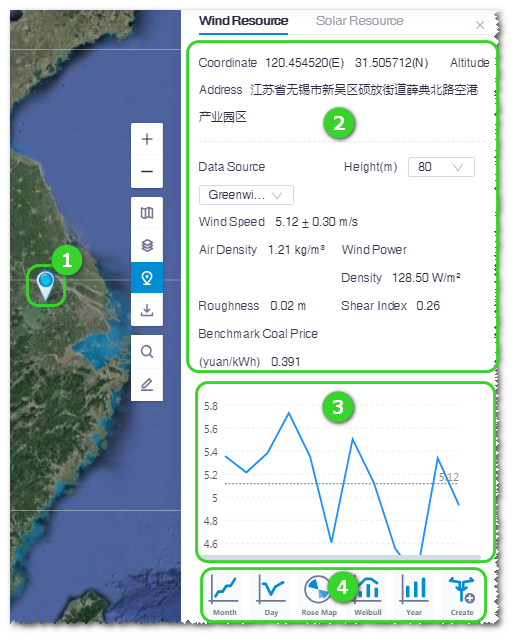
Functional Areas in Data Pane
| No. | Name | Description |
|---|---|---|
| ① | Point marker | Display point in GIS. |
| ② | Point parameters | Display coordinate, altitude, height, air density, roughness, wind speed, and wind power density of the clicked point. |
| ③ | Data graph | Display the data graph with selected graph type. Refer to ④ for graph type. |
| ④ | Graph type selection | Click the icons to display the respective data graph in ③. Refer to the section table Table for more details. |
Click the icons at the bottom of data pane to learn more about wind resource.
| Icon | Name | Description |
|---|---|---|
 |
Monthly profile | Display monthly distribution of wind speed, wind power density, and air density. |
 |
Diurnal profile | Display diurnal distribution of wind speed and wind power density. |
 |
Wind speed rose | Display the rose map of wind speed and wind power density. |
 |
Weibull profile | Display the Weibull distribution. |
 |
Wind speed long term profile | Display the annual distribution of wind speed. |
 |
Create mast | Create a virtual mast in the project tree based on MERRA2 database. Refer to the section for more details Creating a Virtual Mast. |
Creating a Virtual Mast
Virtual mast provides reference for wind data repair and long-term wind resource overview.
Before creating a virtual mast, open the Address detail pane. For details, refer to Resource Detail.
Click the Create Mast icon
 to show the options.
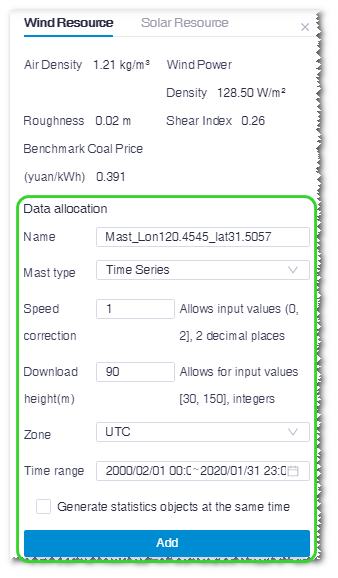
Input the name of virtual mast.
The default name is consisted of longitude and latitude of the clicked point in GIS.
Select mast type. Two types are available:
- tim: Mast data saved in the tim format are mainly applied in the AEP calculation.
- Time series: Mast data saved as time series are mainly applied in the data repair of mast data processing.
Input the relative parameters, including speed correction, download height, zone, and time range.
(Optional) If you select Time series as mast type, click the check box before Generate statistics objects at the same time.
The statistics object is a reference while writing the feasibility study report.
Select a project in the project tree.
Click the Create button to create a virtual mast and statistics object under the project.
Solar Resource Detail
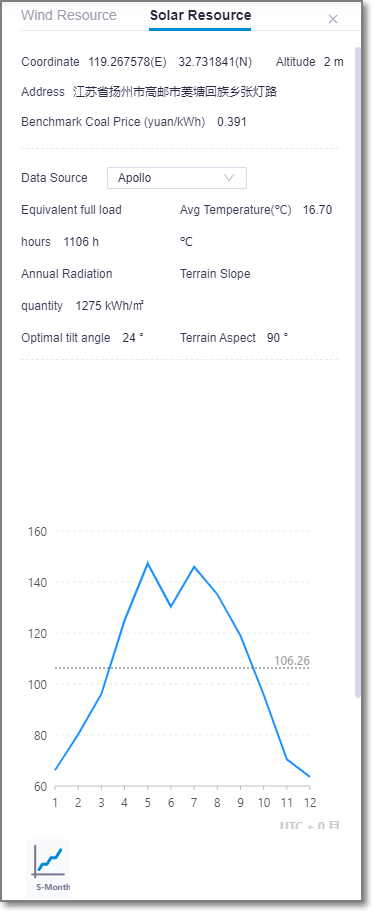
Click Solar Resource to check local pv resource details. Apollo typical year solar resource of China is provided.
You can get more detailed information below the location parameters.
| Equivalent full load hours | The full capacity generation of the pv system(with efficiency of 81.7%)on optimal tilt angle. |
| Avg Temperature | Typical Apollo annual avg temperature |
| Annual Radiation | Typical Apollo annual total radiation at the horizontal level |
| Terrain Slop | The slop of the point according to greenwich 10m terrain data |
| Optimal tilt angle | The angle of pv module when obtaining the maximum irradiation |
| Terrain Aspect | The aspect of the point according to greenwich 10m terrain data |
Data Download
Terrain and roughness information can be downloaded from public data library, and be saved as map files. The download object consists of existing region and drawn region.
Click the data download icon ![]() to open the Data download pane.
to open the Data download pane.
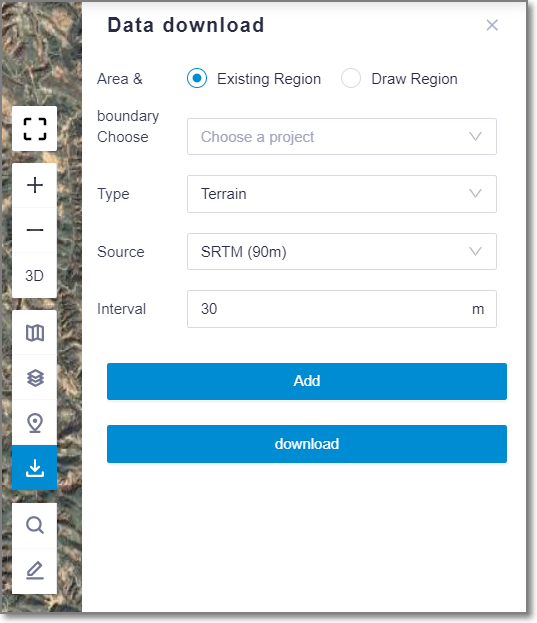
For more information of downloading map, refer to the section Creating a Terrain or Roughness Map based on Polygon .
Location Search
In the Location search page, you can locate a region by searching a location, selecting a administrative region, or locating a point by defining its longitude and latitude.
Position Search
Position search is used for fuzzy search.
- Input the keyword in the search field. The related positions or regions are listed in the drop-down menu.
- Click the desired position. It is displayed in GIS.
Region Location
Region location is mainly applied to locate a administrative region.
Figure: Region Location Interface
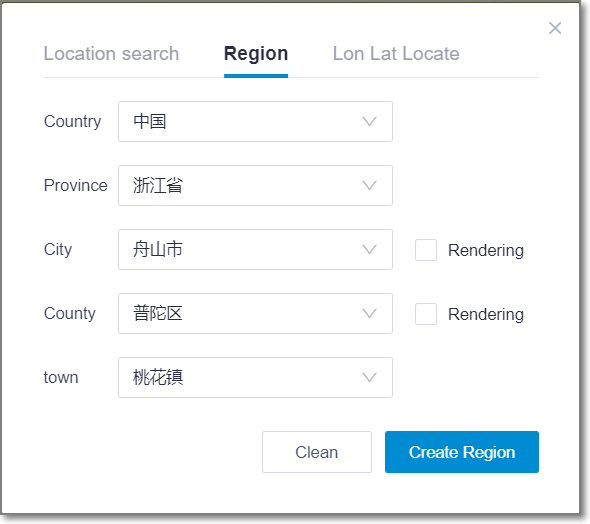
- Select country, province, city, county and town from the drop-down list. The selected region is displayed in highlight in GIS.
- When you select a city or region, check Rendering to view its wind speed grid in GIS.
- Click the Clean button to delete all the selections and restore to the default status.
- Click the project name in the project pane and click the Create Region button. The located region is saved in the project.
Lon & Lat Location
This is mainly applied to locate a point.
Figure: Lon & Lat Location Interface
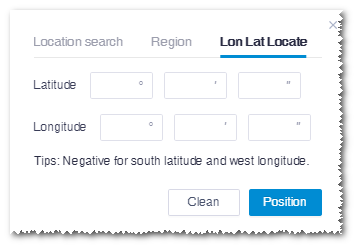
- Input longitude and latitude, and click the Position button to display the respective point in GIS.
- Click the Clean button to delete all the selections and restore to the default status.
Draw and Measure
Tools are divided into two categories: draw and measure.
Click the draw and measure icon ![]() to open the draw & measure toolbar at the top of GIS.
to open the draw & measure toolbar at the top of GIS.

The drawing function is turned on by default.
Draw
Draw a pattern in GIS.
You can draw three kinds of patterns: point, line, and polygon.
- Point: Add a point in GIS. The added point can be saved as substation, route start point, or route pass point. For details about substation creation, refer to the section Substation Design For route start point and route pass point, refer to the section Drawing Start Point and Necessary Point.
- Line: Draw lines in GIS. The lines you draw can be saved as designed route or existing road. For details, refer to the section Drawing a Line.
- Polygon: Draw polygons in GIS. The polygons you draw are used for wind farm planning or unit project as avoiding scope. For details, refer to the section Drawing a Polygon.
Click the Save button to save the drawn point, line, or polygon.
Note
To save the object, select a project first.
Click the Delete button to remove the current drawn pattern.
Click Close to exit the drawing mode.
Measure
In GIS, you are enabled to measure a point, line or polygon with its statistics.
Click Measure to enter the measuring mode.
A tip window appears at the bottom of GIS.
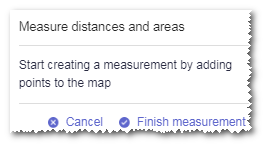
Click a point. Its longitude and latitude information is displayed in the tip window.
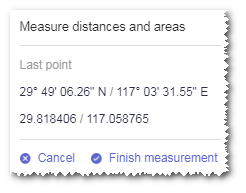
Click another point to display the coordinate information of its location, and the distance between the two points.
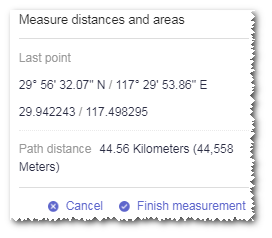
Click a third point to display the coordinate information of its location, and the area of the triangle formed by the three points.
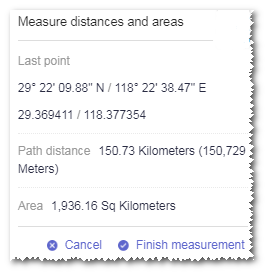
If you continue to click other points, the statistics of the formed polygon is displayed.
To end the measurement, click Finish measurement in the tip window.
Click the drawn figure to display its measurement statistics.
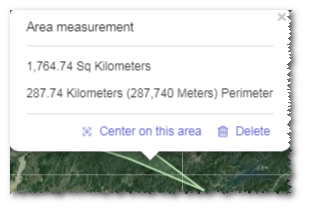
Click Center on this area. GIS is automatically adjusted and located to the view centered on the selected figure.
If the created figure is a point or line, the option name is Center on this location or Center on this line.
Click Delete in the tip window to remove the current figure from GIS.
Drawing a Line
Line is mainly used for route design. Open the drawing toolbar menu before drawing.
Click Line in the drawing panel.
Click two or more points in GIS. The line is drawn successfully.
Double-click to finish drawing. The double-clicked point is taken as the end point of line.
Click the polyline to show its length.
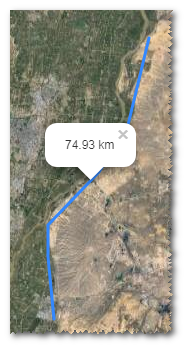
The points clicked is displayed as control nodes
 in GIS. Transparent control nodes are added between every two control nodes. These control nodes are used for changing the location and shape of line.
Drag the control nodes to change the location and shape of line.
Select the project name in the project tree.
Click the Save button to open the New window.
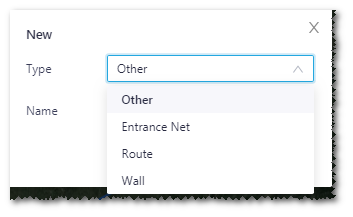
Select type, and input a name for the line.
Click the Done button to save the line.
Drawing a Polygon
Polygon drawing is widely used for wind farm boundary and avoiding scope definition. Open the drawing toolbar menu before drawing.
Click Polygon in the drawing panel.
Click three or more times on GIS to add points. The points you clicked forms the boundary of a polygon.
Double-click to finish drawing. The double-clicked point is taken as the end point of polygon.
The starting point and end point are linked automatically. The polygon is drawn successfully.
Click the polygon to show its area.
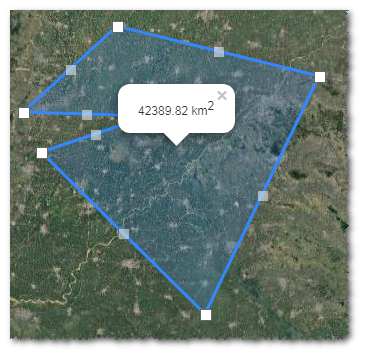
The points clicked is displayed as control nodes
 in GIS. Transparent control nodes are added between every two control nodes. These control nodes are used for changing the location and shape of polygon.
Drag the control nodes to change the location and shape of polygon.
Select the project name in the project tree.
Click the Save icon to open the New window.
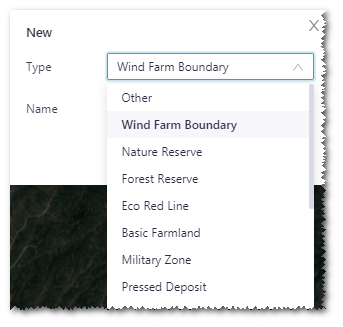
Select type, and input a name for the polygon.
Click the Done button to save the polygon.
Modifying an Existing Polygon
Click the check box of the area object in the project pane.
Click Layer Edit on GIS to expand the layer edit pane.
Click the Edit tab.
Click the Edit button.
The polygon boundary becomes editable.
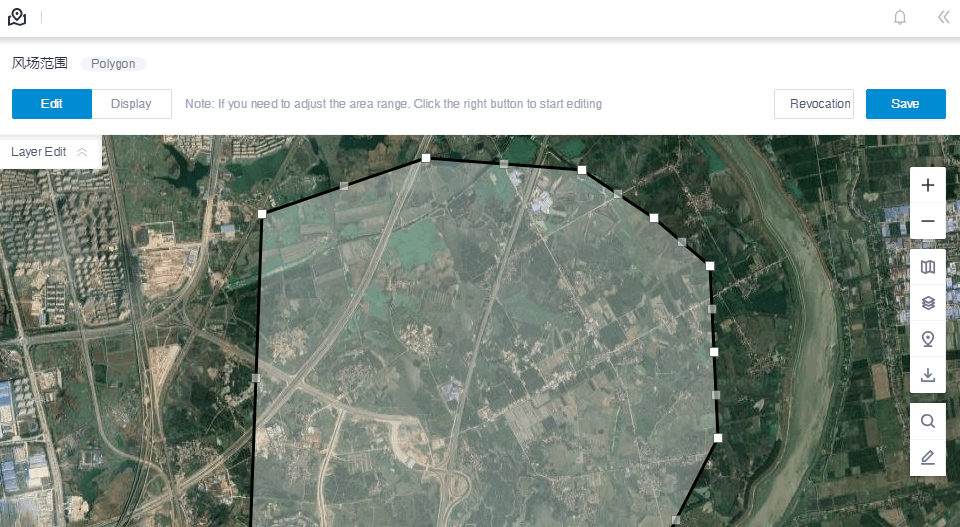
Drag the control nodes to change the location and shape of polygon.
Click the Save button to save the changes.