Access Plan Design
Access plan is the overall design of turbines, circuits, and substations in a wind farm. It is the input of the power line design.
Two approaches are available to design an access plan:
- Automatic access plan : Output an access scheme and relative economic parameters by automatic calculation based on wind farm condition parameters. This approach is applicable in wind farm without design scheme for initial design.
- Manual access design: Manually edit the access scheme of single-line design and match the substations. This approach is mainly applied in scenarios when you have an access plan and want to input it into the Greenwich system, or when you need to modify the existing electric single-line graph.
Configuring Grid-Connected Substations
Before access plan design, you must configure the access points in a access station. At the same time, you may define electricity price for it.
Before configuration, ensure there is at least a grid-connected substation object in the project. For details about how to create a grid-connected substation, refer to the section Creating a Substation Object .
Double-click the grid-connected substation object in the project pane. The access configuration page opens.
Configuring Access Point
Click the Access point tab.
Click Add an access point. An new row is added with no value in the access point parameter columns. Among the parameter columns, the Access Type column is filled with the grid-connected substation access type predefined in the creation process, and it is not editable.
Click the cells to set up the parameters, including access point name, voltage grade, and maximum monospace accessible capacity. The value of maximum monospace accessible capacity is displayed automatically based on the voltage grade you select, and is editable.
Repeat Step 2-3 to add more access points.
Note
When the access type is T-access circuit, no more than one access point is permitted.
(Optional) Click the copy icon
 to copy the corresponding access point.
(Optional) Click the delete icon
 to delete the corresponding access point.
Note
If the substation has been designed for access plan, the point might have been connected to a turbine. In this case, if you delete this point, the completed access plan would be unavailable. It is recommended not to edit or delete access point after access plan design.
Click Save to save all the modification. The system judges the access applicability based on the grid-connected substation parameters. The judgment result is displayed at the left bottom of the page. The result should be one of the following: with access conditions, without access conditions, or consider T-access.
Note
While creating a grid-connect substation, the accessible capacity is calculated based on substation capacity and accessed new energy capacity. When the accessible capacity is lower than 2MW, this substation is not applicable in the access plan. To configure parameters for this kind of substations, the reminder Accessible capacity is less than 2MW is displayed at the left bottom of the page. When you click Save, the judgment result is The access capacity is less than 2MW, and there is no access condition. To cope with this situation, open the operation pane of the grid-connect substation to modify the value of accessible capacity. Refer to the section Modifying Substation Properties for more details.
Configuring Electricity Price of Access Station
Electricity price configuration is the input of economic parameter calculation. You can set it up on this page or in the operation pane (refer to the section Configuring Parameters and Calculating).
Click the Access Station Price tab.
Select the user type. The available options are: electricity grid, electricity sale company, and electricity consumption enterprise.
The selected user type(s) are displayed in your selection order.
Input the company name in the text box at the right side of each user type.
Define the electricity price period of each user type.
a.Click the Define Period button to open the Month Definition window.
b.Click Add month. Period1 is added.
c.Click the + icon in the Period1 area to select months for this period. You can select more than one months.
d.Repeat Step b-c to add more periods and select months for each of them.
Note
In the list of months for selection, the selected ones are disabled.
Note
The total number of selected months should be 12 without anyone missing.
e.(Optional) Click the × icon at the right side of a month name to delete it.
f.(Optional) Click the delete icon
at the right side of the period to delete the corresponding period.g.Click the OK button to save the settings. Each period is displayed as a distribution bar with 24 hours.
Define the electricity price of each time segment.
a.Click on the distribution bar of a period. The bar (24 hours) is divided into two time segments by the time point you click.
b.Click again to divide one of the two time segments into another two segments by the time point you click. At this moment, the bar is divided into three segments.
c.Repeat the steps above to divide the 24 hours of a day into several time segments. Each time point is marked with its time.
d.(Optional) Drag the time point marker to adjust its time.
e.(Optional) Click the time point and click Delete to delete this point. The two segments before and after the deleted time point are combined into one, and the price of the longer segment is adopted.
f.Input the electricity price of each time segment.
Define load data.
Note
This step is only applicable for electricity consumption enterprise. If you selected electricity grid or electricity sale company, skip this step and directly go to Step 7.
Two methods are available to input load data:
Sequential values: Define the load curve by importing load file with time series data. The data are usually in great amount from monitor.
a.Select Sequential values.
b.Click Download template to download the template file. Sequential value load sheet is an Excel file with time and electricity load, and the format is xlsx or xls.
c.Input the electricity load value of each time point.
d.Save changes in the file.
e.Click the Browse button to upload sequential load file. After the upload is completed, the Browse button is replaced by the Replace button. Click this button to reload the load data file.
Statistics: Define he load curve by inputting load statistics. The data are usually in small amount from electricity meter.
a.Select Statistics.
b.Click the Edit button to open the Edit Load Data window.
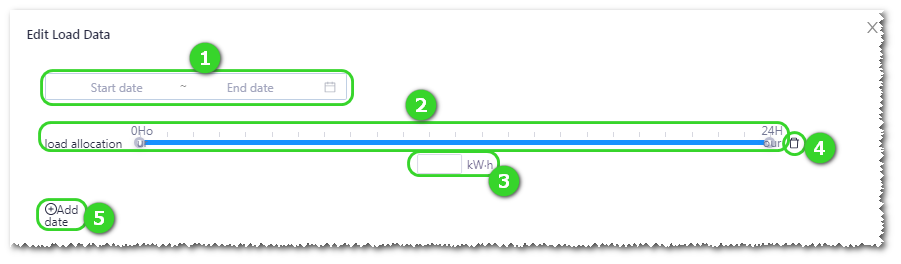
c.Click Add date (⑤) to add a period and define its load.
d.Click in the time selection area ① to define the start and end date of the period.
e.Click on the distribution bar ②. The bar (24 hours) is divided into two time segments by the time point you click.
f.Click again to divide one of the two time segments into another two segments by the time point you click. At this moment, the bar is divided into three segments.
g.Repeat Step e and f to divide the 24 hours of a day into several time segments. Each time point is marked with its time.
h.(Optional) Drag the time point marker to adjust its time.
i.(Optional) Click the time point and click Delete to delete this point. The two segments before and after the deleted time point are combined into one, and the load value of the longer segment is adopted.
j.Input the load value in each time segment in the text box ③.
k.Repeat Step c-j to define load data for more periods.
l.(Optional) Click the delete icon ④ at the right side of a period to delete this period.
m.Click OK to save the settings and close the window.
Note
If you configured both sequential values and statistics, the sequential values are applied in the access plan calculation.
After the load data are input or imported successfully, the load curve is displayed in the load data area.
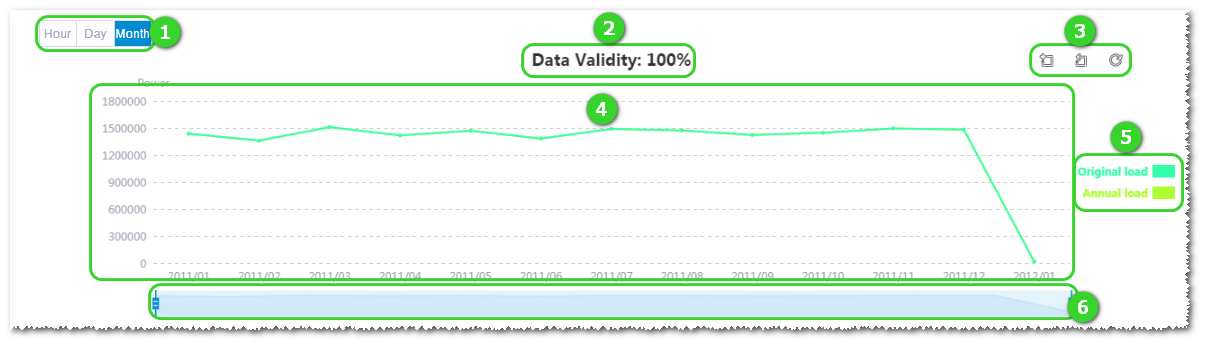
Areas in Load Curve Graph¶ No. Name Description ① Data granularity options Select the data granularity as hour, day, or month. If the granularity of data you imported is day, the display of monthly data graph is available, but not the hourly one. ② Data Validity Display the ratio of annual data validity based on coverage of source data. If the source data are not complete, the system will automatically repair them. ③ Curve scaling and restoring Zoom in a section of the graph, cancel the zoom in, and restore. ④ Load curve Display data graph in a year. Hover the pointer over the curve to check the time and load value of the corresponding point. ⑤ Curve options Click the legend to show or hide original load or annual load in the graph. Original load is the load data sourcing from the user, and annual load is annual load data supplemented by the system based on original ones. ⑥ Time shaft Drag the slider to select time range to be displayed. Click Save to save all the modification.
Automatic Access Plan
Access plan is the automatic calculation of turbines’ access scheme with substation and economic parameters based on evaluation of calculation scope, terrain, access station, and other conditions in a wind farm.
Configuring Parameters and Calculating
Perform access plan after configuration of grid-connected substation.
Before access plan, complete AEP calculation. Refer to the section Wind Farm AEP Calculation for more information.
Double-click the wind farm layout object in the project pane. The Overview page of this wind farm opens.
Select a turbine model series. The selected turbine model series must be configured with the rated power and turbine price in its property pane. Refer to the section Checking Turbine Model Series Property for details.
Configure the applicable tower parameters for the turbine model series. The mandatory tower parameters are the hub height and weight of each tower section. For details of configuring tower, refer to the section Configuring Applicable Tower .
Configure the component group parameters and select a component group in the Overview page. The mandatory parameter for the component group is the output voltage level of generator. Refer to the section Configuring Component Group for details.
Click the WTG group object in the project pane.
Click the expand icon 《 to open the operation pane.
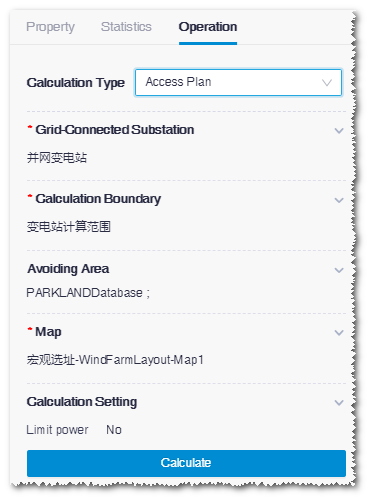
Select Access Plan as calculation type.
Select substation as access station. All accessible grid-connected substation objects in the project are listed, and their accessible capacity, accessible voltage, and electricity price are shown.
If you have set up electricity price in the substation configuration, the price value displayed here is the average value of all prices defined. For more information, refer to the section Configuring Electricity Price of Access Station . If the price has not been defined or if you need to modify it, click to edit the value.
Note
You can select more than on grid-connected substation.
Select the calculation scope. All the area objects defined as wind field in the project are listed in the menu.
Select avoid scope.
There are two sections for avoid scope selection: Database section with avoid areas saved in the system database and user import section listing all area objects other than wind field. You can set buffer in both two sections.
Note
You can select more than one avoid scopes, or select none if there is not any.
Select map. All maps in the project are listed.
Select whether to limit power or not in the Calculation Setting area. When total capacity of turbines within the calculation scope are larger than the accessible capacity of substation and you want to access more turbine capacity, select Yes to limit the total power of turbines within the accessible capacity of substation.
Click Calculate. The calculation task is submitted to the task list. Choose Tools Library > Task List to see the detail.
Checking Access Result
When the calculation is completed, check the single-line design and relative economic parameters.
Open the operation pane to check the overall economic parameters of access plan. Including total access capacity, access IRR, access NPV, discounted year, discounted rate, limiting generation capacity, abandon access point, and abandon access machine.
- When all accessible capacity of the grid-connected substation has been accessed, or the economic value of this access is low, this substation or the access point in this substation is abandoned.
- When the turbine is of low economic value or cannot be accessed because all accessible capacity has been assigned, the turbine is abandoned.
Note
To determine whether to abandon an access point or turbine based on its economic value, the NPV of the related access points or turbines are compared and only that with the optimal economic value is reserved.
Double-click the WTG group object in the project pane. The WTG group Overview page opens.
Click the Single-Line Design tab to check the single-line graph. Single-line graph is a demonstration of the access scheme between turbines and substations, and the grid-connected substation is matched. You can edit the topology or match the substations. Refer to the section Manual Configuration of Single-Line Topology for more details.
Click the Access Economy tab to check the relative economic parameters. The overall economic parameters and those of each access point are both demonstrated.
Click the Download button to download the parameters into a txt document.
Manual Configuration of Single-Line Topology
The single-line topology demonstrates the transmission process of power from turbines to substations and finally to grid. It is realized by designing the substation connections and input/output voltage of these substations. Two steps are consisted for the manual configuration: editing single-line design and matching substation. Matching substation should be performed after substation siting.
Editing Single-Line Design
This section is about how to edit the path to access turbines, turbine transformer, self-built substation, and grid-connected substation for single-line graph configuration.
Double-click the wind farm layout object in the project pane. The Overview page of this wind farm opens.
Select a turbine model series. The selected turbine model series must be configured with the rated power in its property pane. Refer to the section Checking Turbine Model Series Property for details.
Configure the component group parameters and select a component group in the Overview page. The mandatory parameter for the component group is the output voltage level of generator. Refer to the section Configuring Component Group for details.
Click the Single Line Design tab to show all turbines in this wind farm.
Click the Edit Single-Line Graph button to enter the edit mode.
Check a turbine or some turbines. (Optional) Check Full selection (Click to select all unconnected turbines) to select all unconnected turbines.
Note
For turbines to be accessed into one turbine transformer or self-built substation, their voltage grade should be the same. If turbines with different voltage grades, they cannot be accessed to the same substation. You need to classify them by voltage grade and access them respectively. This rule is applicable to access other substations mentioned hereinafter.
Create a new connection.
a.Click Establish Connection >Create Connection. The Establish Connection window opens.
b.Select a type in the Type of new substation drop-down menu.
Transformer substation
Grid-connected substation
Box substation
Note
In this step, it is recommended to select a box substation.
c.Select a voltage in the Exit voltage of substation drop-down menu. The voltage in the In voltage of substation row is the voltage of selected turbine(s).
d.Click OK to connect a substation to all selected turbines. While accessing box substation, choose Match Box Substation > Match 10 kV Box Substation / Match 35 kV Box Substation to access all selected turbines to a pre-defined box substation.
Select the newly-added box substation and repeat Step 7 to connect substations.
You can click Select all box substations (Click to select all unconnected box substations) to select all unconnected box substations.
Note
In this step, it is recommended to select a transformer substation.
(Optional) Select transformer substations and follow Step 7 to connect them to a grid-connected substation.
(Optional) Connect an existing object.
a.Select turbine(s) or substation(s).
Note
The object(s) you select here must be empty, that is, turbine or substation object(s) that has not been matched or connected.
b.Click Establish Connection > Connect Existing Objects.
c.Select a substation. All the selected empty objects are connected to this substation.
(Optional) Hover the cursor over a circuit, the Delete the connection option and the exit voltage level are displayed. If you click Delete the connection, the current circuit and all circuits and substations at its right side are deleted.
Note
If the circuit or substation at its right side is connecting to other circuits, only the current circuit is deleted.
Follow Step 6-11 to configure single-line graph to all turbines.
Note
For power line design, you must access turbines to self-built substations. Turbines without self-built substation connection will not be calculated in wire optimization.
Note
If all turbines are finally connected to a self-built substation, in wire optimization calculation of power line design, they will be connected to this self-built substation along power line. If turbines are connected to different self-built substations, in wire optimization calculation of power line design, they will be connected to the respective substations based on the configured single-line design.
Click Save after the single-line design is completed.
Click the return icon
 to go back to the single-line topology overview page.
Matching Substation
After substation siting, match self-built substation and grid-connected substation. This section introduce how to match an individual substation in single-line topology.
Double-click the wind farm layout object in the project pane. The Overview page of this wind farm opens.
Click the Single-Line Design tab to show all turbines in this wind farm.
Click the Edit Single-Line Graph button to enter the edit mode.
Click the substation icon in topology to open the Match Object window.
The substations listed in the Choose Object drop-down menu are self-built substations in the project.
Note
Only substations with the same input and output voltage grade as defined in single-line topology are listed and can be matched successfully.
Select a substation and click OK. This substation is matched successfully.
Match all the self-built and grid-connected substations following Step 4-5.
(Optional) Click the Clear the editor button to clear all modifications.
Click Save.
Click the return icon
to go back to the single-line topology overview page.