
Data Panel
On data panel, you are enabled to select filters and indices to check the calculation result.
- Double-click the mast to be analyzed. The DataTrace page opens.
-
Click the DataPanel tab.
Figure: Data Panel Interface 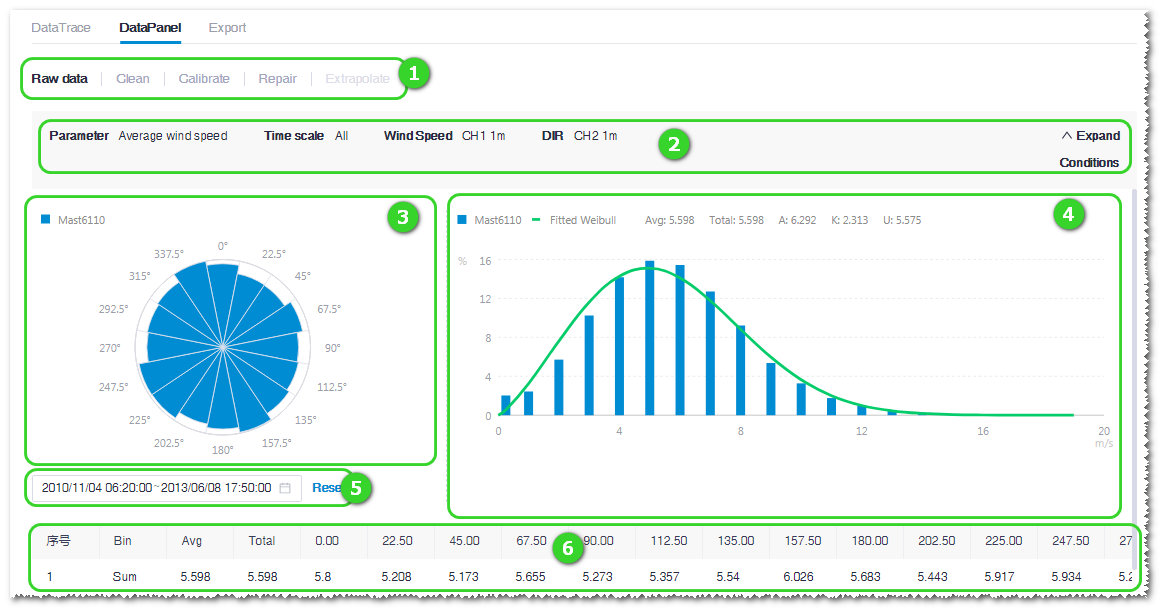
Table 1. Controls and Areas in Data Panel Interface No. Name Description ① Data analysis progress bar Show the completed mast data processing steps. ② Selected filters Select filters, and the graphs and tables below are displayed based on these filters. ③④ Graphs Generated based on the selected filters. ⑤ Time range selection Show the time range of data displayed in the graphs. ⑥ Wind speed data table According to the filters and graphs, the data details classified by sector, year, month, or day are listed in this table. - Click a tab in the progress bar and set up filters and time range. The graphs and table showing wind speed data are updated accordingly.