
Configuring Operation Mode
This module defines the operation mode of the turbine model, including power curve and noise curve.
- Double-click the turbine model object in turbine library. The corresponding configuration page opens.
- Click the Operation mode overview tab to check the operation mode menu list.
Adding an Operation Mode
Click Add operation mode to open the operation mode
setup page.
Note: To modify the existing operation mode, click
Edit at the right part of the operation mode
record to open the setup page. The settings are the same as that of
adding a new operation mode.
The operation mode setup page consists of three sections, that is,
basic settings, power curve, and noise curve. The configuration is
demonstrated as in the following sections:
Basic Settings
Input the parameters in the Basic Settings
area.
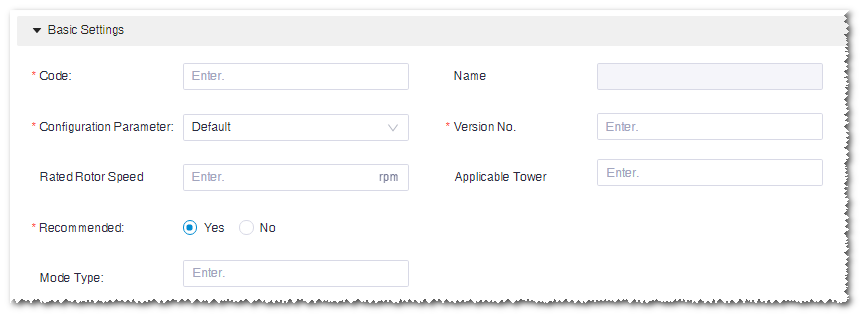
The items marked with a red * are mandatory. Pay attention to the following parameters:
The items marked with a red * are mandatory. Pay attention to the following parameters:
| Parameter Name | Option | Description |
|---|---|---|
| Configuration parameter | Default | Standard blade form |
| Serrations | Blade form with serrations | |
| Mode type | Default | Turbine operation mode tags. You can select more than one of them. |
| Boosting | ||
| Noise | ||
| Derating | ||
| Applicable tower | All applicable towers in the turbine model series to which this turbine mode belongs | You can select more than one towers. |
Note: For a turbine model, only one common operation mode is permitted.
Power Curve
-
Expand the Power curve area.
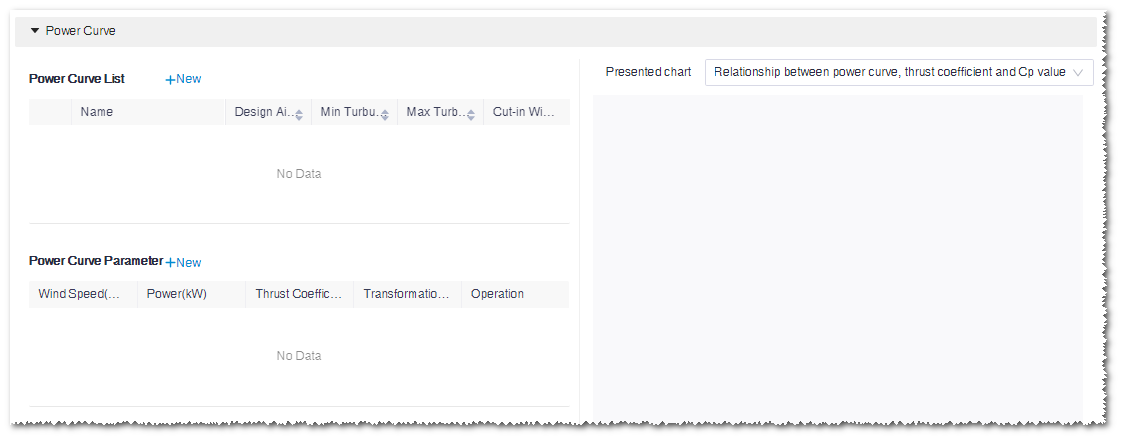
- Click New at the right top of Power curve list. The New power curve window opens.
-
Select Manually added.
The items marked with a red * are mandatory.Note: If you select Import, click Template download, modify in the template file, and upload it.
- Input the power curve parameters.
- Click OK. A new power curve record is added in Power curve list.
-
Input wind speed, power, and thrust coefficient in the Power
curve parameter table.
- Wind speed: The wind speed of power curve
- Power: The output power at the respective wind speed
- Thrust coefficient: The thrust coefficient at the respective wind speed
Note: To edit the existing power curve parameter, double-click the item in the Power curve parameter table. - (Optional) Click New at the right top of the Power curve parameter table. A wind speed record is added at the bottom of the table.
-
(Optional) Click the delete icon
 in the Operation
column of the Power curve list or
Power curve parameter table to delete the
corresponding power curve or wind speed record.
in the Operation
column of the Power curve list or
Power curve parameter table to delete the
corresponding power curve or wind speed record.
-
Select power curve(s) in the Power curve list
and check the power curve graphs at the right side of the page.
- Relationship between power curve, thrust coefficient and Cp value: show the relationship among power curve, thrust coefficient, and Cp value
- Power performance rendering: show power production performance by the k value of Weibull function and full-load hours
- Comparison chart of power generation performance at a specific K value: show power production performance in a specific k value
Note: In the Power performance rendering mode, no more than two curves can be selected.Note: In the Relationship between power curve, thrust coefficient and Cp value view, if you select two or more power curves, only the power curves are displayed without the Ct and Cp graphs.
Noise Curve
-
Expand the Noise curve area.
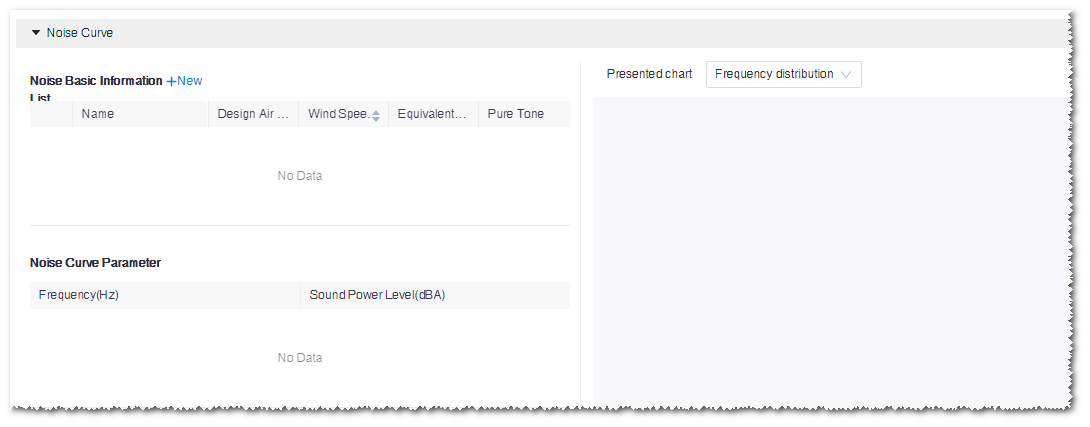
- Click New at the right top of Noise basic information list to open the New noise curve window.
- Select Manually added.
-
Input the noise curve parameters.
Type, wind speed at hub height, and design air density are
mandatory items.
Three options are available for noise curve, that is,
Single frequency, One third
octave, and Octave.
- Single frequency: The sound power level with a specified single frequency
- One third octave: The sound power level displayed by frequencies divided into three sections
- Octave: The sound power level displayed by frequencies
Note: If you select Import, click Template download, modify in the template file, and upload it. - Click OK. A new noise curve record is added in the Noise basic information list.
- (Optional) Double-click in Noise basic information list to edit the noise curve information.
- Select a noise curve. The corresponding parameters are displayed in the Noise curve parameter table.
-
Input the Sound Power Level in the
Noise curve parameter table.
Note: If there is value as power curve level, double-click the cell to modify it.Note: When the noise curve type is One third octave, click the switch button at the right top of the Noise curve parameter table to switch between the Octave mode and 1/3-octave mode.
Saving Operation Mode
Click the Create button in the operation mode setup
page. A new operation mode is added in the menu list.
Note: If you edited the existing operation mode, click the
Save button after you complete the
configuration. The original one is accordingly refreshed.
- After you configure the Basic settings parameters, the operation mode is available to be created.
- After you add a new operation mode, double-click the turbine model to open the configuration page and the newly added operation mode is displayed.
- After the parameters in the basic settings, power curve, or noise curve sections are set, Configured is marked in the correspond section.
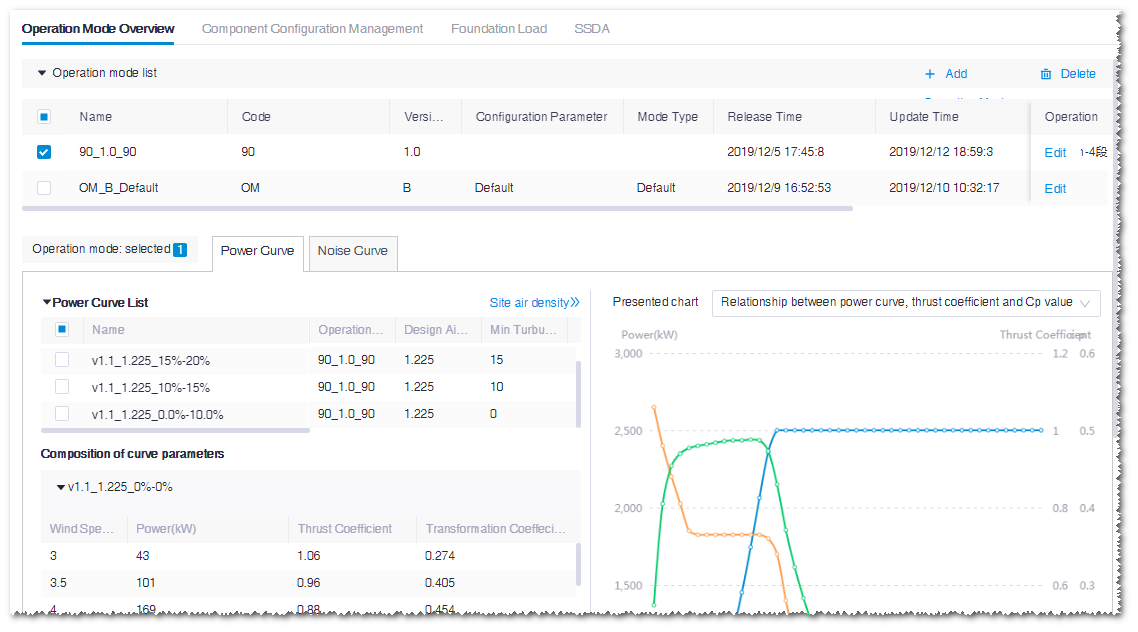
Checking Operation Mode
-
Select operation mode in the Operation mode list on
the Operation mode overview page.
-
Click the Power or Noise tab
to check the curve details.
Note: If no power curve or noise curve is available for the operation mode, a tip is displayed on the interface. Click Edit to redirect to the corresponding power curve or noise curve setup page.
Checking the Site Air Density Conversion
By default, the power curve displayed is in the standard air density, that is,
1.225kg/m3. This condition is not suitable for all wind farms. Considering the
actual air density, the standard power curve should be transformed into actual power
curve. In the AEP calculation, the actual power curve is adopted.
- Click Site air density at the right top of the power curve or noise curve table to open the Site air density page.
- Select a power curve. The options are power curves selected in Power curve list of the current operation mode.
- Input Site air density.
-
Click the Conversion button.
- The table at the left side shows the power before and after conversion at various wind speeds
- The graph at the right side shows the two power curves before and after the conversion
-
When you finish checking the conversion, click back
 at the left
top to return to the Operation mode overview
page.
at the left
top to return to the Operation mode overview
page.