Economy Map
Based on the Greenwich mesoscale data, the economy map module calculates the economic value of the project under various power price by simplifying cost evaluation. It helps you located target economically optimal areas within a large-scale area (at the level of province, city, or county).
Configuring for the Calculation
This section introduces how to configure the economy map calculation parameters.
Before the configuration, define an area as the analysis object. Two methods are available: Draw a polygon (refer to Drawing a Polygon ) or download an area (refer to Data Download ).
Click the polygon in the project pane.
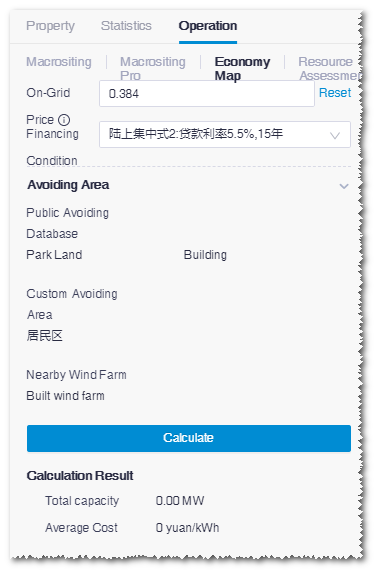
Click the expand icon at the right top of the interface to open the operation pane.
Click the Operation tab.
Click the Economy map tab.

Define the on-grid power price.
Select the financing condition. The system provides three financing modes of centralized onshore wind farm.
Select avoiding area. Three categories are available:
- Public avoiding database: Show the data library of green land, buildings, river system, road, etc. embedded in the system.。
- Custom avoiding area: Show the customized areas defined as protection area, farm land, minerals, etc. For more details, refer to the section Drawing a Polygon .
- Nearby wind farm: Show all wind farm objects in the project. Select the wind farm(s) nearby to calculation its wake effect with this one.
Note
Skip this step if no exhibited area exists within this area.
Click Start Calculation. The task is submitted successfully.
Choose Tools Library > Task List.
Select Economy map in the task type list to check the task status. When the progress reaches 100%, the calculation is completed.
Checking Calculation Result
This section introduces how to modify the relevant parameters of the area and check the IRR distribution level in sub-areas of this area.
Click the check box of the area object in the project pane.
Click Layer Edit on GIS to expand the layer edit pane.
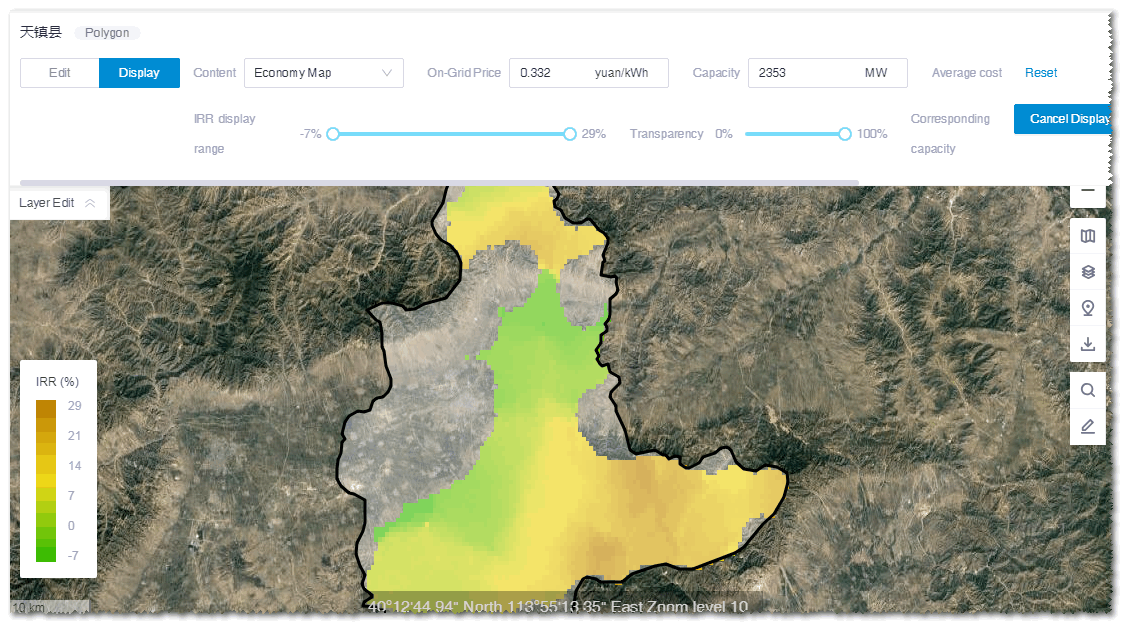
Click the Display tab to check the map analysis result. According to the parameters defined in the Map Analysis panel, the on-grid power price is loaded automatically, and the capacity and cost are calculated.

(Optional) Modify the price, capacity, and cost.
The customized cost is taken as the average cost within the area. Combined with this customized cost and the Greenwich mesoscale wind speed and terrain data, the system adjusts and calculates the cost of each point in the area and projects the IRR level of each point.
Drag the IRR display range slider to adjust the IRR display range. The corresponding capacity sum within the defined IRR range is displayed at the right side of the slider.
(Optional) Click Reset to restore to the default settings.
Click Display to display the IRR distribution corresponding to the defined parameters. By analyzing the economy condition under various parameters, the target areas for further evaluation and siting are located.