Mast Data Processing
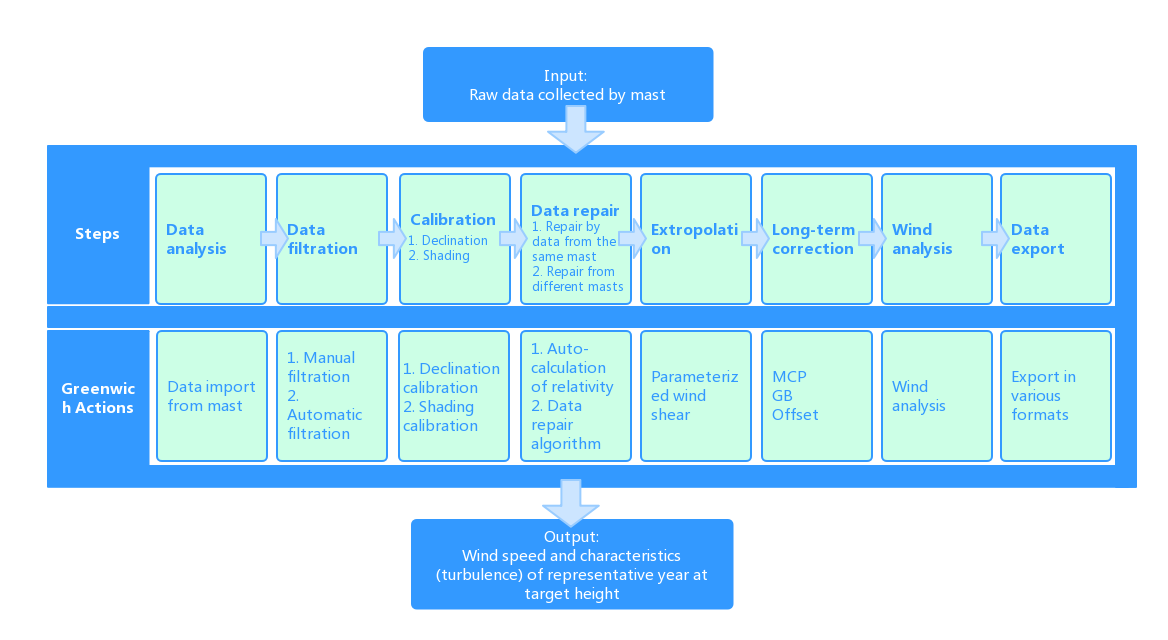
To acquire the average wind speed, wind characteristics, and circumstance analysis of mast long-term (20/25 years) data, the data collected by the mast must be filtered and processed.
The process is shown as in the following figure:
Figure: Mast Data Processing Procedure
Importing Mast Data
Before you deal with mast data, import the data into project in Greenwich.
Select a project name in the project pane.
Click the Import/Export icon
 to open the Import/Export page.
On the Create page, select the category as Met mast. The mast data import window opens.
Click the Upload button to open the file selection dialog and select a mast data file.
The file format of mast data file are RWD, NDF, txt, tab, and tim. The differences among these formats lie on the data recording format. The details are shown in the table below:
Click the Open button to start upload.
You can select more than one files at a time.
Check the upload progress in the list at the bottom of this page.
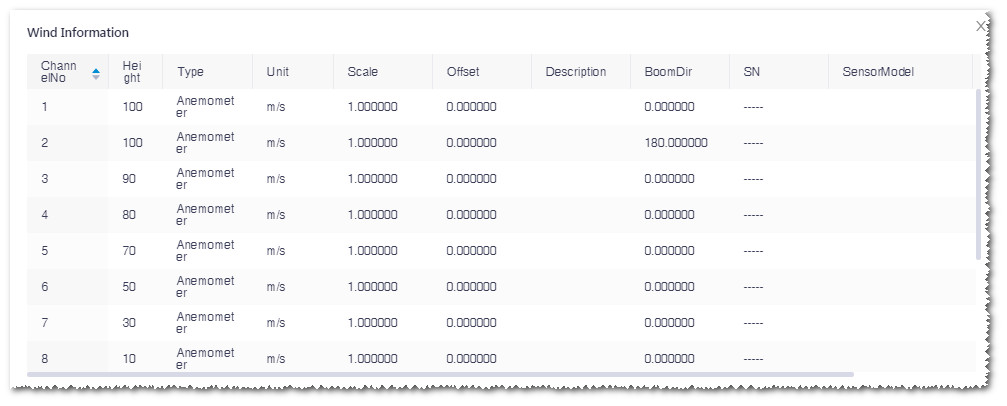
Click a row to see the sensor configuration information after the upload is completed.
Sensor Configuration Parameter Introduction¶ Name Description Channel ID This column is only visible on the txt file import page. Normally, the channel ID in the mast data file is loaded into this table automatically. If the format in the file is not standard, the ID might not be recognized. You will need to modify it in the file. Customized name This column is only visible on the txt file import page. Normally, the customized name in the mast data file is loaded into this table automatically. If the format in the file is not standard, the name might not be recognized. You will need to modify it in the file. Sensor type This item is mandatory. Normally, the sensor type marked in the mast data file is loaded into this table automatically. If the format in the file is not standard, the sensor type might not be recognized. You will need to select one manually. Sensor consist of the following types:

By height This item is mandatory. Normally, the sensor height in the mast data file is loaded into this table automatically. If the format in the file is not standard, the sensor height might not be recognized. You will need to input the value manually. Data type This column is only visible on the txt file import page. Include Avg, SD, Max and Min. Scale It is a variate to calculate the linear relation between wind speed and anemometer rotate frequency. Data are loaded from the file automatically. Offset It is a parameter to calculate the linear relation between wind speed and anemometer rotate frequency. Data are loaded from the file automatically. Unit Unit of the data collected by mast. For different sensor types, the units are different. Verify sensor configuration according to sensor standardization report.
Click OK to generate a mast in the project pane.
For imported mast file in the RWD format, before you click OK, input the password if you have set one.
If the sensor configuration changes, the confirmation dialog opens to confirm treatment on the modification, and then the generation continues.
The newly created mast is in the project pane.
Check this mast to show its location in GIS.
Click the mast and open the Property pane.
Click the Check Channel Info button to check the recommended mast configurations.
Double-click the mast in the Project pane to open the Data Trace page for mast data analysis.
Click the Auto button to start mast data processing according to the predefined logic (Not recommended). The logical sequence is: auto-data clean, declination calibration, shading calibration, data repair, extrapolation, and long-term correction.
If you do not want to deal with the mast data in the auto mode, perform the procession step by step.
Figure: Mast Data Processing Procedure
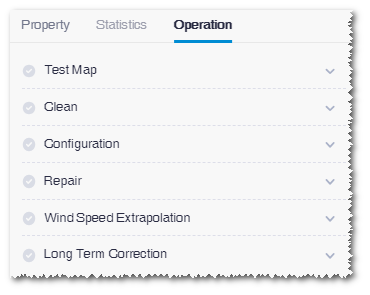
Click the expand icon at each step to show its configuration and set them manually. After you apply the configuration of a step, the √ icon at its left side is lighted. Click the Cancel button to cancel all the application of configuration.
Location Validation
- Select the mast in the Project pane and click the expand the expand icon《 to open the operation pane.
- Click the Property tab to view the mast properties. Compare with the map or Google map to validate the mast location, or edit its longitude and latitude values.
- Click the expand icon
 beside Test Map to show the relative options.
 - Select a map in the Used Map drop-down menu. The items listed in the menu are all the map objects in the project.
- Click the Application button. The validation result is shown, and elevation difference is output.
- When Coordinate and Elevation Difference are both marked by a √ icon at the left side, the mast location validation result is proved to be successful.
- If either one of Coordinate and Elevation Difference is marked by ×, the validation fails. You need to check the longitude, latitude, and elevation of mast, update the parameters in Property pane, and rerun the validation until success.
Data Filtration
To filter the mast data, two methods are provided: automatic and manual filtration.
Click the expand icon
 beside Data Clean.
Click the Auto button to perform the automatic filtration.
When the filtration is completed, a message pops up: Apply success!. The invalid or abnormal data points are tagged automatically. Check the filtration details in the 10min data series on the DataTrace page. The steps to be performed are shown below.
Click the Manual button in the operation pane. The Clean tab on the DataTrace page opens.
Click the icon
 to switch to 10min data series. The data filtration page is displayed as show in the following figure:
Figure: Data Filtration Interface
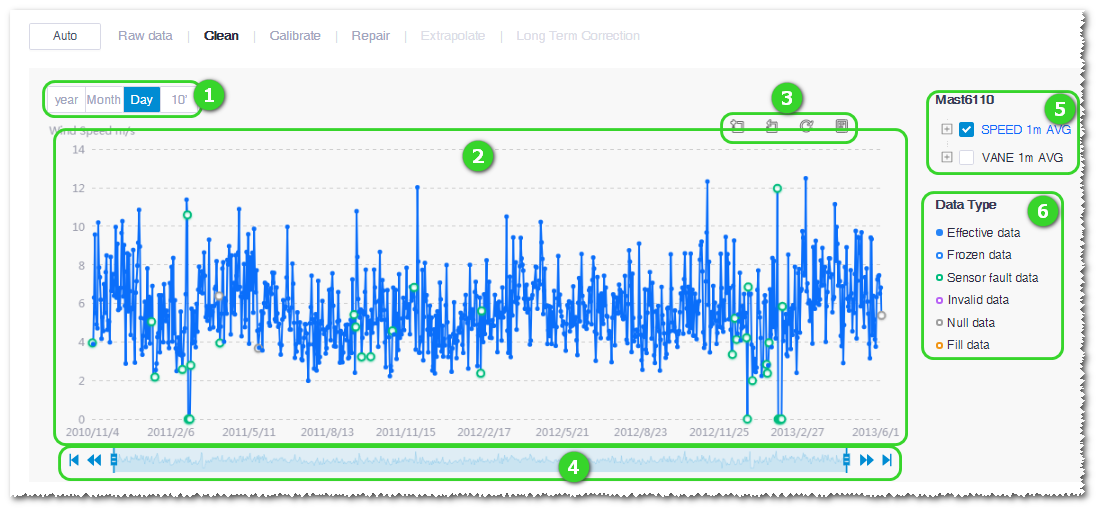
Controls and Areas in Data Filtration Interface¶ No. Name Description ① Data granularity options Select the data granularity as year, month, day, or ten minutes.
Note
Data filtration must be performed in 10min data.
② Time series graph of mast data Display wind speed distribution by time series. ③ Graph scaling and restore Zoom in the graph in a selected area, cancel the zoom in, restore to original, and click  to show the data view of each data point.
④ Time shaft Select the time range of data shown in the graph. Drag the slider to select the time range of data display; click the proceed icon  to switch to the next range of data display; click the back icon
  to switch to the previous range of data display; click
  to switch to the last range of data display; click
  to switch to the first range of data display.
⑤ Sensor channel list Select sensor channels to be displayed in the data graph. You can select more than one channels. ⑥ Legend of data point quality tags Demonstrate different colors of data quality tags. Click the radio button at the center of a tag legend. As you click the data point in the graph, it is tagged as the selected color with its represented data quality. Select a channel in the sensor channel list. The graph is updated accordingly.
Click the zoom in icon and draw a rectangle on the graph. Repeat this step until it is clear to see the individual data points and their tags.
Click a point to tag its quality. The quality tags are classified as follows:
- Valid data: Normal data
- Frozen data: Wind speed sensor fails and temperature detected by temperature sensor is under 4 degree
- Sensor anomaly data: Data detected by wind speed/temperature/wind direction/voltage/air pressure sensors are showing the same value in a long term
- Invalid data: Abnormal data that the values are too high or low
- Blank data: No data collected
Click two points on the graph as the start point and end point. These two points are tagged with the color you select in the legend.
If you want to cancel the selection of a data point, right-click it.
Select and confirm the selected sensor channel, and click the Commit button. This section of data is tagged successfully.
Repeat Step 6-9 to tag more data sections.
Note
If you need to cancel the filtration, click Cancel Auto in the operation pane to cancel all settings done in the auto-filtration, or click Cancel All to cancel all filtrations.
Calibration
Three sections are included in calibration, Declination, Shading, and Turbulence modify, for elimination of wind speed errors that might occur in calculation. Refer to Greenwich knowledge center for more details.
Click the expand icon
 beside Configuration in operation pane.
Click the Configuration button beside Declination. The declination page opens.
The type, longitude, latitude, altitude, method, and erection time of mast are displayed. You can modify the method and time.
The method is recommended as the default according to the mast parameter. You may select one manually from IGRF14 and WMM2015.
Click the Calculate Magnetic Declination Angle button. The Calculation results field shows the declination degree to be corrected.
After confirmation, click the Apply button to add the declination parameters in operation pane.
Note
If you want to delete the declination result, click
 . The message Successful Deleted pops up indicating the corresponding result is deleted.
Click the Configuration button beside Shading. The Shading page opens.
Select the wind speed sensor channel for correction.
Note
Generally, select two sensor channels at the same height.
Select wind direction sensor.
Define the time range.
Click the Calculation button.
After calculation, the mast shade graph is displayed at the lowe right side of this page, showing the wind speed distribution of sensor channel 1 and 2.

The concave section is a result from wind speed reduction due to mast shade in sensor channel 1, and data in sensor channel 1 should be corrected. The convex section is a result from mast shade in sensor channel 2, and data in sensor channel 2 should be corrected.
The Angle area displays recommended angles for mast shade correction.
The wind speed between start and end angles of sensor channel 2 are used for correction of that between start and end angles of sensor channel 1.
You can modify the recommended angles manually.
Click the Apply button to add the shading parameters in operation pane.
Note
If you want to delete the shading calibration result, click
 . The message Successful Deleted pops up indicating the corresponding result is deleted.
Click the Application button in the Configuration area, the calibrations are applied.
If you want to cancel all the applied calibrations, click the Cancel button.
Mast Data Repair
When some mast data are missing, relative data from the same mast or other mast are useful to fix them up.
Based on user experience, the following criteria are applied to judge if it is necessary to repair mast data (only when wind measurement has been performed for more than a year):
- If the data availability rate is higher than 95%, no repair is necessary.
- If the data availability rate is between 80% and 95%, perform data repair.
- If the data availability rate is lower than 80%, abandon these data because they are invalid.
Click the expand icon
 beside Repair in operation pane.
Click the Configuration button. The data repair page opens.
Figure: Mast Data Repair Interface
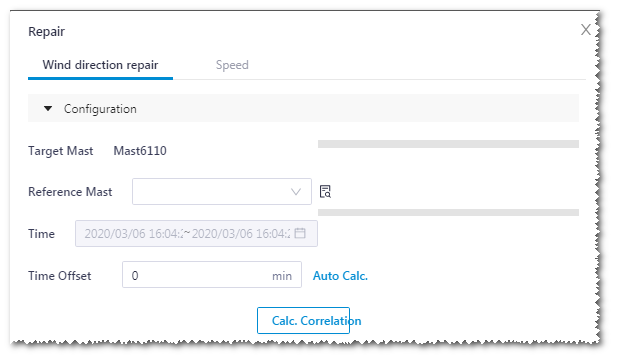
On the Wind direction repair page, select a referential mast in the Reference Mast drop-down menu.
All the mast in the project are listed in the menu.
- If the selected target mast is the same as the referential one, repair is performed with data from the same mast.
- If the selected target mast is different from the referential one, repair is performed with data from a different mast.
The progress bars beside the target and referential mast show the time range with valid mast data. Only when the two time ranges overlap in some sections, the mast data repair is applicable.
Click the note icon
 beside Reference Mast to view the completed data processing steps of the selected referential mast. The completed steps are marked by √.
Select the time range for data acquisition in the Time field.
Click the Auto Calc. button to show how the correlation varies as the time offset changes. The recommended time offset value is marked.
Input the time offset value in the Time shift field. You can use the value recommended by the system, or input a customized one.
Click the Calc. Correlation button to show the correlation settings.
In the displayed Correlation table below, check the data availability and correlation, and select the channel to be repaired.
The Availability column displays completeness of channel data, and the other column displays the correlation of data for repair.
Note
The calculation of correlation only considers wind direction.
Set up repair parameters, such as No. of sectors, result, and method.
Two options are provided for repair method:
- Offset: Based on offset, get the respective time range and repair target mast data with the corresponding referential mast data.
- Replace: Replace a section of target mast data with the referential mast data within the same time range.
Click the Calculation button to show the repair results.
The fitting regression algorithm consists of LLS (linear least squares fitting) and OLS (ordinary least squares fitting). The value 0 represents the calculation without reckoning with offset time.

Select the result display pattern.
 : Show the rate of change before and after the data repair
 : This is the default option, showing the absolute value of the difference between data before repair and data after repair
 : Show the values before and after repair
Select a repair result.
Click the Apply button to add the repair result into the tower repair section of operation pane.
Repeat Step 2-15 to add more results of data repair.
Click the Application button in operation pane.
After the application of data repair, a message appears saying Application successful. The mast data analysis page opens and the Repair tab on the progress bar of mast data processing is highlighted.
Set up the wind speed repair on the Speed page following the steps above. The result is wind speed or Weibull k value variation. Unnecessary details are not given here.
Note
Both wind direction and wind speed should be repaired. Repair the wind direction first, or else the sectors in wind speed repair are not accurate.
Wind Speed Extrapolation
When turbine hub height mismatches the mast data collection height, wind shear is applied to extrapolate the wind speed at the hub height. To calculate wind shear, the mast data should be consisted of data from at least two heights.
Click the expand icon
 beside Wind Speed Extrapolation in the operation pane.
Click the Configuration button to open the configure page.
Select extrapolation type.
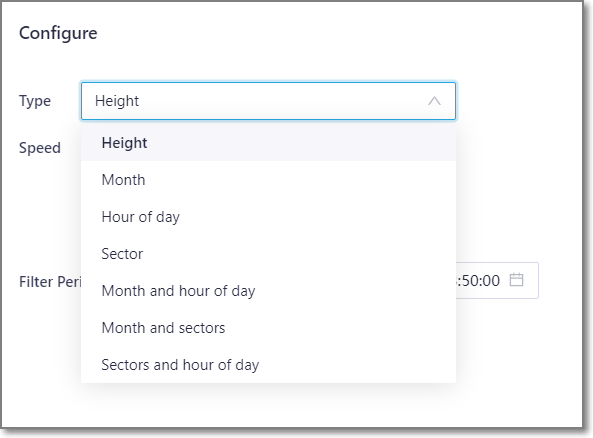
Select wind speed channel.
Note
Select at least two channels.
Define the filter conditions in Filter Period.
Click the Calculate button. The shear curve is shown at the right side of this page.
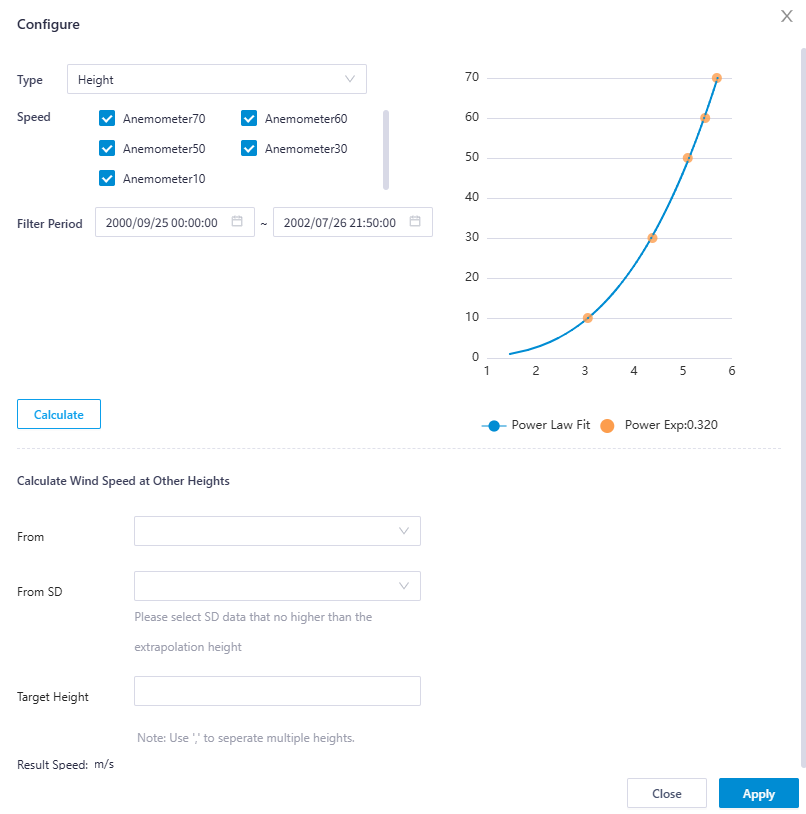
Repeat Step 3-6 to regenerate the shear curve.
In the Calculate Wind Speed at Other Heights area, select a standard height from the From drop-down menu.
The standard height should be the same as the wind speed channel height.
From the From SD drop-down menu, select a SD height. SD height be copied to the Target Height for turbulence extrapolation.
Input the Target Height value as extrapolated height.
When the extrapolation type is selected as Height, the Result speed value is displayed automatically.
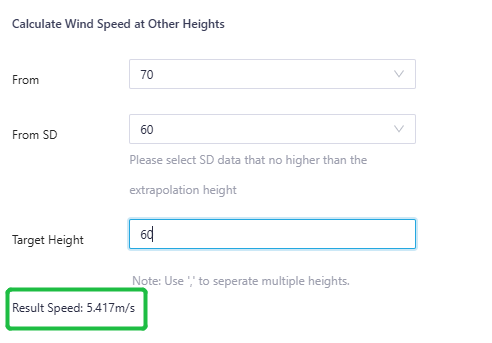
You can input multiple extrapolated height divided by ‘,’. Correspondingly, the Result speed field are filled with multiple values.
Note
For the same height, only one height will be extrapolated.
Click the Apply button to add the result to the Wind Speed Extrapolation area in the operation pane.
If you want to change the wind shear configuration, repeat Step 3-10.
Click the Application button in the operation pane. The Extrapolate page opens, showing the wind speed time series of extrapolated heights according to the specified fitting manner and standard height.
Long Term Correction
Long term correction calculates the 20-year wind resource at the mast location based on the full year wind data within long term data.
Click the expand icon
 beside Long Term Correction in the operation pane.
Click the Configuration button to open the Configuration page.
Select parameters for correlation check in the Data and Resource section.
Figure: Data and Resource Parameters
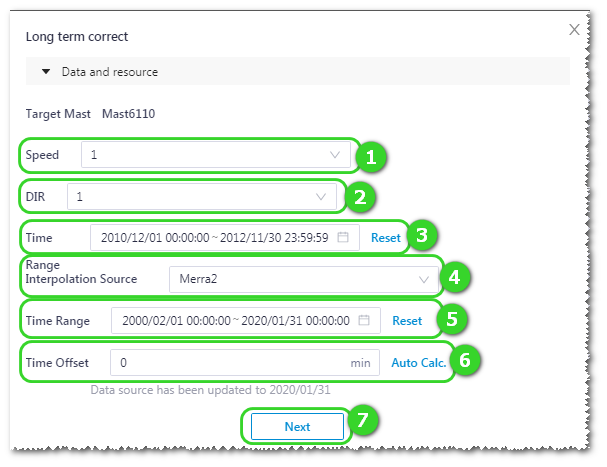
Controls and Areas in Data Filtration Interface¶ No. Name Description ① Wind speed channel Wind speed sensor channel height ② Wind direction channel Wind direction sensor channel height ③ Mast time range Select the time range of representative year. If the selected time range is shorter than a year, a warning icon  appears, telling you the time range of mast data and referential data is shorter than a full year and the correction in GB or OFFSET mode will deviate by season.
④ Data source Including Merra and Merra2. For definition of them, refer to Greenwich knowledge center. ⑤ Time range of 20 years Define start and end date of 20 years. ⑥ Time shift Input the value of time shift and click the Auto Calc. button to open the time shift graphs with recommended time shift value.
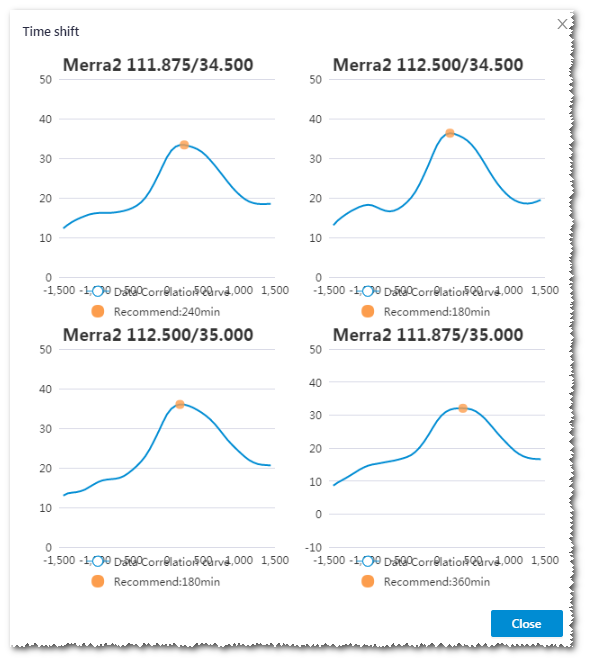
⑦ Next button Click this button to calculate the correlation. Click the Next button. Four grid points of data source which are located nearest the mast are displayed in the correlation table. The data source with highest correlation is checked automatically.
Select the desired grid point data.
Set up the following parameters in the correction parameters area:
Sector: Sectors divided for calculation result.
Method: For definitions of the three modes, MCP, GB, and OFFSET, refer to Greenwich knowledge center.
Based on standard study, use the OFFSET mode if the highest correlation is lower than 75%; or else,, use the MCP mode.
For details of the MCP and OFFSET mode, refer to the section MCP Mode and OFFSET Mode.
If you want to correct data based on national standard, select the GB mode.
Ref. data set: Select the mast data set for sector division.
Click the Calculation button. The result is shown.
a.Select the result display content.

b.Select the result display pattern.
 : Show the rate of change before and after the data repair
 : This is the default option, showing the absolute value of the difference between data before repair and data after repair
 : Show the values before and after repair
Check the result preview.
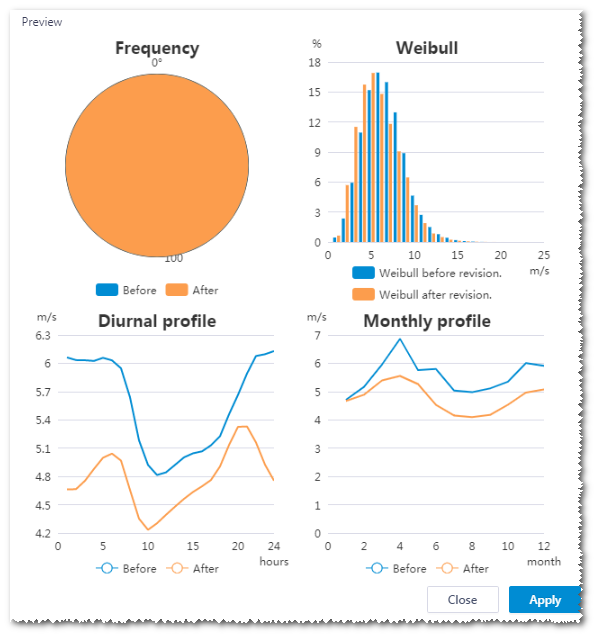
Click the Apply button to add the result to the Long Term Correction area in the operation pane.
Click the Application button in operation pane.
When the application is done, the message appears: Application successful. A new mast is created in the project pane embedded with data after long term correction. This mast is named as <original mast name>_MCP/OFFSET/GB, whose suffix is determined by the mode you selected in the Parameters area.
MCP Mode
Complete correlation calculation in the long term correction page before you perform the following steps.
- Select MCP in the Method drop-down menu in the parameters area.
- Select a mast in the Ref. data set drop-down menu.
- Click the Calculation button. The calculation starts.
- When the calculation is completed, select Hours in the drop-down menu of result.
- Select the item with the smallest absolute value in the result table.
- Click the Apply button to add the result to the Long Term Correction area in the operation pane.
- Click the Application button in the operation pane to accept the long term correction result. The 20-year data are displayed in the graph area.
OFFSET Mode
Complete correlation calculation in the long term correction page before you perform the following steps.
Select OFFSET in the Method drop-down menu in the parameters area.
In the Ratio area, input the ratio between wind speed within mast time range and that within long term data time range.
Click the Calculation button. The calculation starts.
Click the Apply button to add the result to the Long Term Correction area in the operation pane.
Click the Application button in the operation pane to accept the offset correction result.
Because no long term correction data are applied, the time range of data output by the OFFSET mode is the same as that of the mast.
Data Panel
On data panel, you are enabled to select filters and indices to check the calculation result.
Double-click the mast to be analyzed. The DataTrace page opens.
Click the DataPanel tab.
Figure: Data Panel Interface
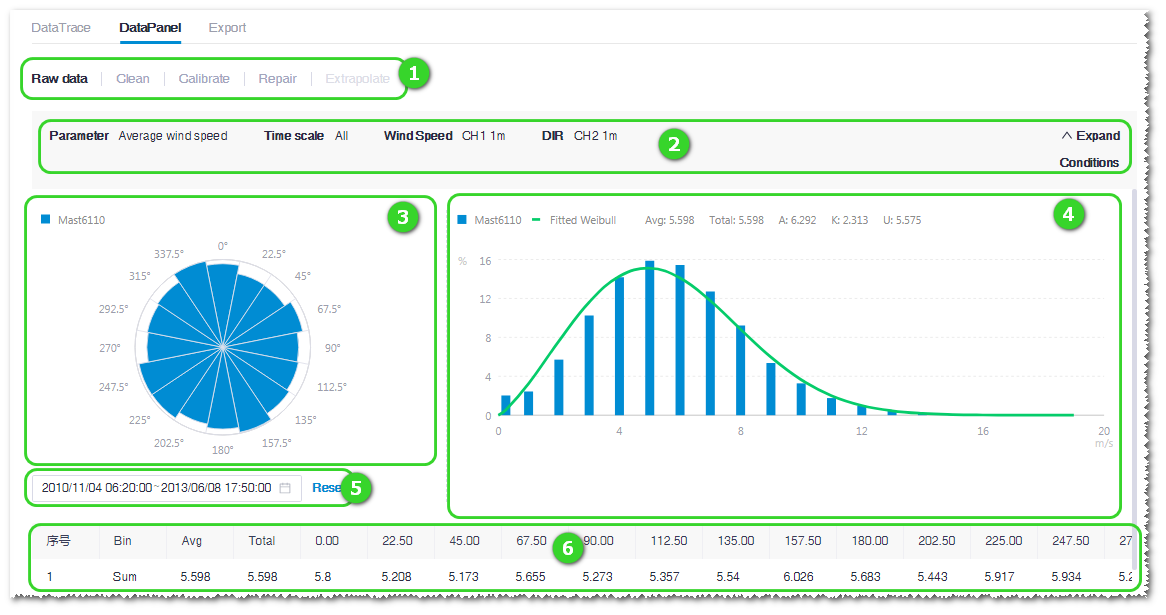
Controls and Areas in Data Panel Interface¶ No. Name Description ① Data analysis progress bar Show the completed mast data processing steps. ② Selected filters Select filters, and the graphs and tables below are displayed based on these filters. ③④ Graphs Generated based on the selected filters. ⑤ Time range selection Show the time range of data displayed in the graphs. ⑥ Wind speed data table According to the filters and graphs, the data details classified by sector, year, month, or day are listed in this table. Click a tab in the progress bar and set up filters and time range. The graphs and table showing wind speed data are updated accordingly.
Mast Data Export
The mast data can be exported as various formats for successive calculations as AEP calculation, report generation, etc.
Double-click the mast in the project pane. The DataTrace page opens.
Click the Export tab.
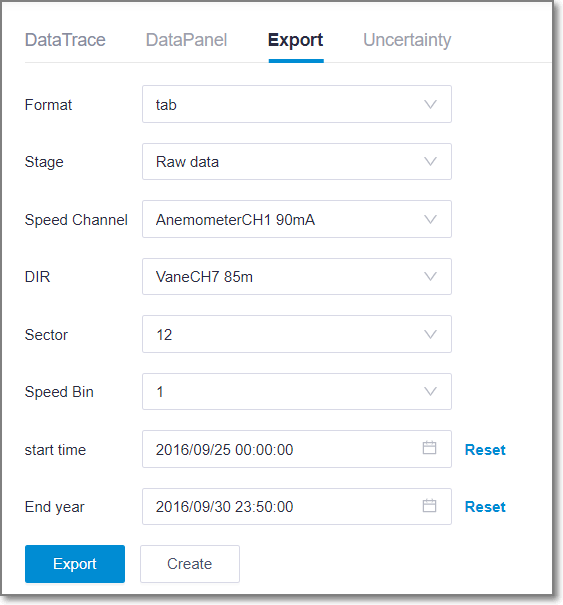
Select a format in the Format drop-down menu.
Set up the parameters for file export.
The parameters displayed in gray are not editable.
The editable items varies for different export format.
Click the Export button to export the mast data as a file in the specified format.
(Optional) Click the Create button to create a new mast in the project based on the parameters you selected.
Uncertainty Check
During mast data processing, the precision might not be perfect, which is called uncertainty. Check the uncertainty in the mast data analysis page.
Double-click the mast in the project pane. The DataTrace page opens.
Click the Uncertainty tab. The statistics of mast data uncertainty is displayed.
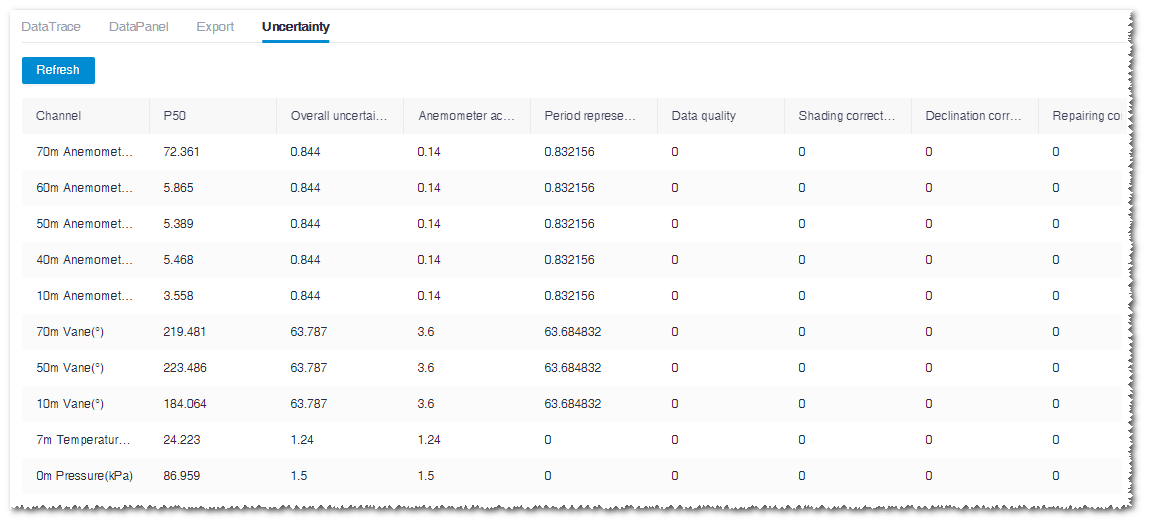
The overall uncertainty and uncertainty of each data processing step are listed for your reference.
In case the mast data configuration changes, click the Refresh button to update the data in the table.