Wind Farm Noise Calculation
During the process of wind farm planning, noise is one of the vital elements influencing the turbine layout. To calculate the noise of a point, the turbine model, wind farm terrain, temperature and humidity of air are all considerable factors to be included.
Adding a Noise Point
Noise point is the location to be evaluated for its environmental noise, such as houses, factories, etc. Before noise calculation, add a noise point first.
Before adding a noise point, ensure there is a WTG group file (kml format) saved in your computer. In addition, install the Google Earth application to define points.
Note
The steps demonstrated here in Google Earth are only for functional explanation, and may not reflect the application’s latest appearance and functions.
Launch Google Earth and choose File > Open to import the WTG group file. The map shows the scope loaded from the WTG group file.
Find the point to be marked, and click the Add Marker icon
 to open the New Marker window.
Input the name and coordinate.
If you input no coordinate, the coordinate of the central point in the displayed scope is adopted.
Click OK to complete. The newly added marker appears in the map and the Location pane.
Click the marker in the Location pane, and choose File > Save > Save location as … to save this marker as a kml file.
Click the project name in the project pane in Greenwich.
Click the Import/Export button
 in the operation button area.
On the Create page, select Noise receiving point in the menu.
Click the upload button to load the kml file of the marker saved from Google Earth.
Select Point from the Point Type drop-down menu.
Input the name in the Object Name field and click the Import button.
When the import is completed successfully, the message pops up: Import file successful. The newly added noise point appears in the project pane.
Noise Calculation
Configure noise point, its circumstances, map, and turbine before noise calculation.
Select a WTG group object in the project pane.
Click the expand icon 《 at the right top of Greenwich interface to open the operation pane.
Select Noise Calculation from the Operation Type drop-down menu.
Select a model from the Calculation Model drop-down menu. Only one option is available ISO 9613-2 General.
Click the Model Settings button in the settings area to open the corresponding window.
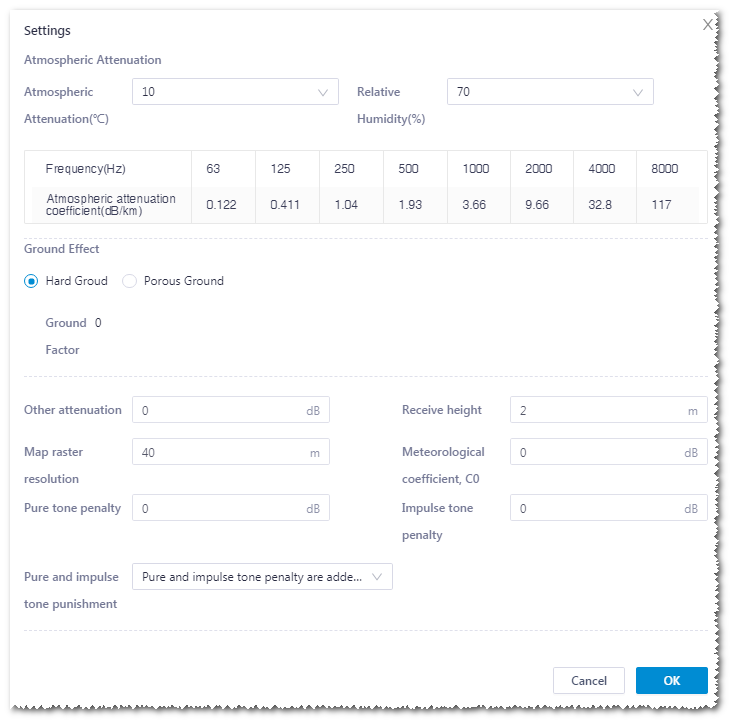
Figure: Noise Settings Window

Controls and Areas in Noise Settings Window¶ Area Option Description Atmospheric attenuation Atmospheric temperature Input atmospheric temperature at noise point. Relative humidity Input relative humidity at noise point. Frequency Noise frequency Atmospheric attenuation coefficient The coefficient of each frequency in this field is displayed automatically according to the atmospheric temperature and relative humidity you input. Ground effect Hard ground This is the default option. The ground factor is 0 and not editable. Porous ground This is an advanced option. Set up the ground factor around turbine and receiver or between them. Other settings Other attenuation Other items that might cause attenuation. Receiver height above ground The default value is 2m. Grid resolution Set up grid density for noise calculation. Meteorological coefficient C0 Meteorological coefficient C0 Pure tone penalty Pure tone penalty Impulse tone penalty Impulse tone penalty Pure and impulse tone punishment Pure tones penalty is added to total noise impact at receptors; Pure and impulse tone penalty are added to WTG source noise Click OK to save all the settings and close the window, or click Cancel to close the window without save.
Click the expand icon
 in the Map area.
Select a map object from the Terrain drop-down menu.
All the map files in the project and public map libraries are listed in the menu. If you select the public map library, the corresponding map is extracted from it according to the computational boundary you select in the later step. The extracted map boundary is expanded by 5 km from the square frame of computational boundary.
Click the Done button to save the changes.
Click the expand icon
 in the Receiver and Thresholds area. All the noise points in the project are listed.
Select the noise point(s).
You can select more than one points.
For details of noise point, refer to the section Adding a Noise Point .
Click the Threshold setting button at the right side of noise point. The settings window opens.
Figure: Noise Point Threshold Setup

Click a cell in the table to edit the value.
Note
Day and night are not specification of time range but two groups of background noise settings.
After setup, click the OK button to save the changes.
Click the expand icon
 in the Turbine Configuration area.
Click the Configuration button at the right side of the WTG group. The Overview page of the WTG page is displayed.
Click the Noise Calculation button in the Overview page. All parameters related to noise calculation are listed in the table.
Select turbine and set up the noise power version, hub height, turbine model series, turbine model, operation mode, power curve, etc.
For details of sound power version, refer to the section Noise Curve .
Click the Save button to save the changes.
In the operation pane, click Done to save the settings.
Click the expand icon
 in the computational boundary.
All the boundary objects in the project, including polygons and regions, are listed in the menu.
Click Calculate. After the task is submitted, a message pops up: Task has been submitted. Please go to task list. .
Choose Tools Library > Task List and select Noise Calculation from the drop-down menu.
When the task progress reaches 100%, click the project name in the project pane, and click the refresh button
 in the operation button area. The newly generated noise object appears in the project pane, named NoiseMap1.
To check the calculation results, refer to the section Checking Calculation Results.
Checking Calculation Results
When noise calculation is completed, the noise details are available in GIS and noise overview page of WTG group.
Compete noise calculation before performing the following steps. For details, refer to the section Noise Calculation .
Click the check box before the noise object generated from calculation, and expand the Layer Edit panel to check its sound pressure level in GIS.
Input the value of upper limit and lower limit.
Input the limit that you are interested in. Generally, the sound pressure limit around houses is 40, and 50 for factories.
Note
The value of upper limit must be larger than that of lower limit.
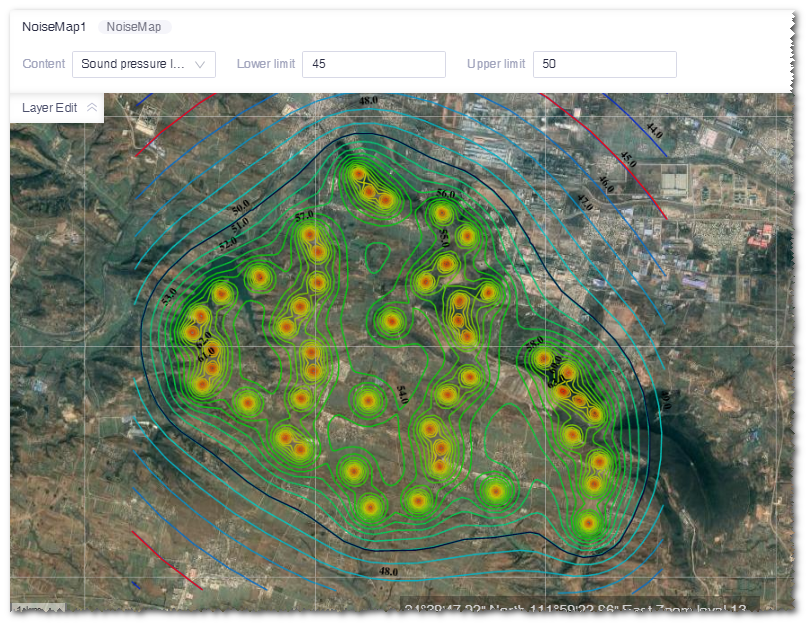
Click the Display button. The sound pressure level line in the lower limit is in red, and that in the upper limit is in black.
Figure: Sound Pressure Level Limit

Double-click the WTG group object in the project pane. The WTG group overview page opens.
Click the Noise Calculation button in the Overview page. All parameters related to noise calculation are listed in the table, including NearestSensitivePoint, DistToNearestSensitivePoint, and Ratio.
Double-click the cell under the Ratio column to change its value.
Click the Noise Overview tab to check the noise details of this wind farm.